
Recently I started learning Windows Kernel Exploitation, so I decided to share some of my notes in form of a blog.
In the previous parts I shown how to set up the environment. Now we will get familiar with the payloads used for privilege escalation.
What I use for this part:
Just to recall, we are dealing with a vulnerable driver, to which we are supplying a buffer from the userland. In the previous part we managed to trigger some crashes, by supplying a malformed input. But the goal is to prepare the input in such a way, that instead of crashing the execution will be smoothly redirected into our code.
Very often, the passed payload is used to escalate privileges of the attacker’s application. It can be achieved by stealing the Access Token of the application with higher privileges.
Viewing the Access Token
Every process running on the system has it’s EPROCESS structure that encapsulates all the data related to it. You can see the full definition i.e. here. (The EPROCESS structure has some slight differences from one version of Windows to another – read more). Some members of EPROCESS, such as PEB (Process Environment Block), are accessible form the user mode. Others – i.e. the mentioned Access Token – only from the kernel mode. We can see all the fields of EPROCESS using WinDbg:
dt nt!_EPROCESS

As we can see, the field Token has an offset 0xF8 from the beginning of the structure.
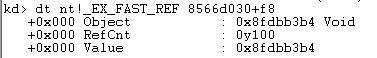
Let’s display the details of the type containing the token:
dt nt!_EX_FAST_REF

The token is stored in a union _EX_FAST_REF, having two fields: RefCnt (reference counter) and Value. We are interested in replacing the Value only. The reference counter should better stay untouched for the sake of application stability.
Now, let’s have a look at tokens of some applications running on the Debuggee machine. We can list the processes using:
!dml_proc
Example:
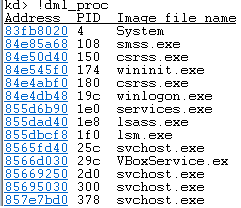
The first column shown is an address of EPROCESS structure corresponding to the particular process.
Now, using the displayed addresses, we can find more details about chosen processes.
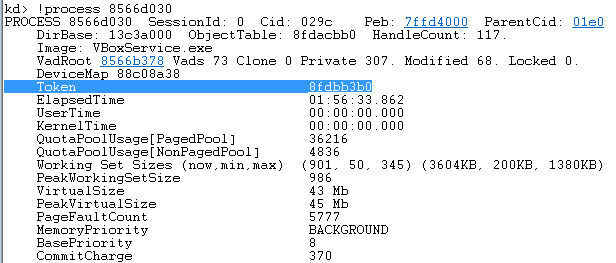
!process [address of EPROCESS]
We can notice the Access Token among the displayed fields:
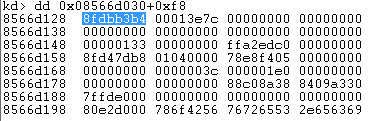
We can also display the token in more low-level ways:
dt nt!_EX_FAST_REF [address of EPROCESS] + [offset to the Token field]
Or:
dd [address of EPROCESS] + [offset to the Token field]
As we can conclude from the above, the function !process automatically applied the mask and filtered out the reference counter from the displayed information. We can do the same thing manually, applying the mask that removes last 3 bytes with the help of eval expression:
?[token] & 0xFFFFFFF8

Stealing the Access Token via WinDbg
As an exercise, we will run a cmd.exe on a Debuggee machine and elevate it’s privileges from the Debugger machine, using WinDbg. See the video:
First, I am listing all the processes. Then, I am displaying Access Tokens of the chosen processes: System and cmd. I copied the the Access Token of System to into cmd, applying appropriate masks in order to preserve the reference counter. As a result, cmd.exe got elevated.
The token-stealing payload
Now we have to replicate this behavior via injected code. Of course it is not gonna be as easy, because we will be no longer aided by WinDbg.
Some well documented examples of the token-stealing payloads are provided as a part of Exploit code in the official HEVD repository: https://github.com/hacksysteam/HackSysExtremeVulnerableDriver/blob/master/Exploit/Payloads.c
The purpose of all the included payloads is the same: stealing the Access Token. However, we can see that they are in a bit different variants, appropriate for particular vulnerabilities. Most of their code is identical, only the ending differs (commented as “Kernel Recovery Stub“). It is a code used to make all the necessary cleanups, so that the application will not crash while returning after the payload execution.
Anyways, let’s take a look at the generic one:
https://github.com/hacksysteam/HackSysExtremeVulnerableDriver/blob/master/Exploit/Payloads.c#L186
First of all, we have to find the beginning of EPROCESS structure. With WinDbg there was no effort required to do this – it was just displayed on the command. Now, we need to find the beginning of this structure by our own, navigating through some other fields.
As a starting point, we will use KPCR (Kernel Processor Control Region) structure, that is pointed by FS register on 32bit versions of Windows (and by GS on 64 bit).
The code presented above takes advantage of the relationship between the following structures:
KPCR (PrcbData) -> KPRCB (CurrentThread) -> KTHREAD (ApcState) -> KAPC_STATE (Process) -> KPROCESS
KPROCESS is the first field of the EPROCESS structure, so, by finding it we ultimately found the beginning of EPROCESS:
When the EPROCESS of the current process has been found, we will use it’s other fields to find the EPROCESS of the SYSTEM process.
LIST_ENTRY is an element of a double link list, connecting all the running processes:
The field Flink points to the LIST_ENTRY field of the next process. So, by navigating there and substituting the field’s offset, we get a pointer to the EPROCESS structure of another process.
Now, we need to get the PID value (UniqueProcessId) and compare it with the PID typical for the System process:
This is the corresponding code fragment in the exploit:

Once we have EPROCESS of the System as well as EPROCESS of our process, we can copy the token from one to another. In the presented code reference counter was not preserved:
When we look for the offsets of particular fields, WinDbg comes very handy. We can display commented structures by the following command:
dt nt!
For example:
dt nt!_KPCR

dt nt!_KPRCB
0x120 + 0x004 = 0x124
That gives the mentioned offset:

Writing the payload
We can write the code of the payload by inline assembler (embedded inside the C/C++ code) as it is demonstrated in HEVD exploit:
https://github.com/hacksysteam/HackSysExtremeVulnerableDriver/blob/master/Exploit/Payloads.c#L63
However, in such case our code will be wrapped by the compiler. As we can see, some additional prolog and epilog was added:
That’s why we have to remove the additional DWORDs from the stack before we return, by adding 3*sizeof(DWORD) = 12 (0xC) to the stack pointer (ESP):
https://github.com/hacksysteam/HackSysExtremeVulnerableDriver/blob/master/Exploit/Payloads.c#L94
If we want to avoid the hassle, we can declare our function as naked (read more here). It can be done by adding a special declaration before the function, i.e.:
__declspec(naked) VOID TokenStealingPayloadWin7()
https://github.com/hasherezade/wke_exercises/blob/master/stackoverflow_expl/payload.h#L16
Another option is to compile the assembler code externally, i.e. using NASM. Then, we can export the compiled buffer i.e. to a hexadecimal string.
As an exercise, we will also add some slight modification to the above payload, so that it can preserve the reference counter:
https://github.com/hasherezade/wke_exercises/blob/master/stackoverflow_expl/shellc.asm
Compile:
nasm.exe shellc.asm
Then, we can open the result in a hexeditor and copy the bytes. Some of the hexeditors (i.e. HxD) have even a support to copy the data as an array appropriate for a specific programming language:

You can see the both variants of the payload (the inline and the shellcode) demonstrated in my StackOverflow exploit for HEVD:
https://github.com/hasherezade/wke_exercises/tree/master/stackoverflow_expl
Compiled: https://drive.google.com/open?id=0Bzb5kQFOXkiSWTJOS2VZZ0JiU3c
See it in action:
Details about exploiting this vulnerability will be described in the next part. See also writeups by Osanda and Sam added in the appendix.
Appendix
https://osandamalith.com/2017/04/05/windows-kernel-exploitation-stack-overflow/ – Osanda Malith on Stack Overflow
https://www.whitehatters.academy/intro-to-windows-kernel-exploitation-3-my-first-driver-exploit/ – Sam Brown on Stack Overflow
https://briolidz.wordpress.com/2013/11/17/windbg-some-debugging-commands/ – a handy set of commonly used WinDbg commands

Pingback: IT Security Weekend Catch Up – June 25, 2017 – BadCyber
Pingback: 半月安全看看看2017六月(下) – 安全0day
dt nt!_EX_FAST_REF 8566d030+f8
RefCnt: 0y100
Is this a typo in windbg? RefCnt is 3bit. So is this a binary string?
Odd that !process strips from Value, but not here.
Do you mean this point:
https://hshrzd.files.wordpress.com/2017/06/token_details.png ?
It is not a typo. 0y100 means just a binary number (0y -> binary prefix, like 0x for hex). See this:
https://docs.microsoft.com/en-us/windows-hardware/drivers/debugger/masm-numbers-and-operators
Very nice article. Thanks for sharing! 🙂
Great article but in your modified payload code shouldn’t it be: and edi, 0x07 instead of and edi, 0x03 (because thre RefCount is 3 bits)?
yes, you are right. thank you for noticing it. fixed!
No worries. 🙂
First time I decide to ask the question as I stumble along the road learning about computers. So with a grade 9 education and intuition of why my computer is not working right. I search how do I steal the Kernel in Windows. I guess my intuition is well founded. Now I need to go on another learning curve.
Hahaha
Pingback: Weekendowa Lektura 2017-06-25 – bierzcie i czytajcie | Zaufana Trzecia Strona
Neat and clear, thank you:)